Immigrants from Bahamas vs Immigrants from North America No Schooling Completed
COMPARE
Immigrants from Bahamas
Immigrants from North America
No Schooling Completed
No Schooling Completed Comparison
Immigrants from Bahamas
Immigrants from North America
2.2%
NO SCHOOLING COMPLETED
11.6/ 100
METRIC RATING
205th/ 347
METRIC RANK
1.6%
NO SCHOOLING COMPLETED
99.8/ 100
METRIC RATING
56th/ 347
METRIC RANK
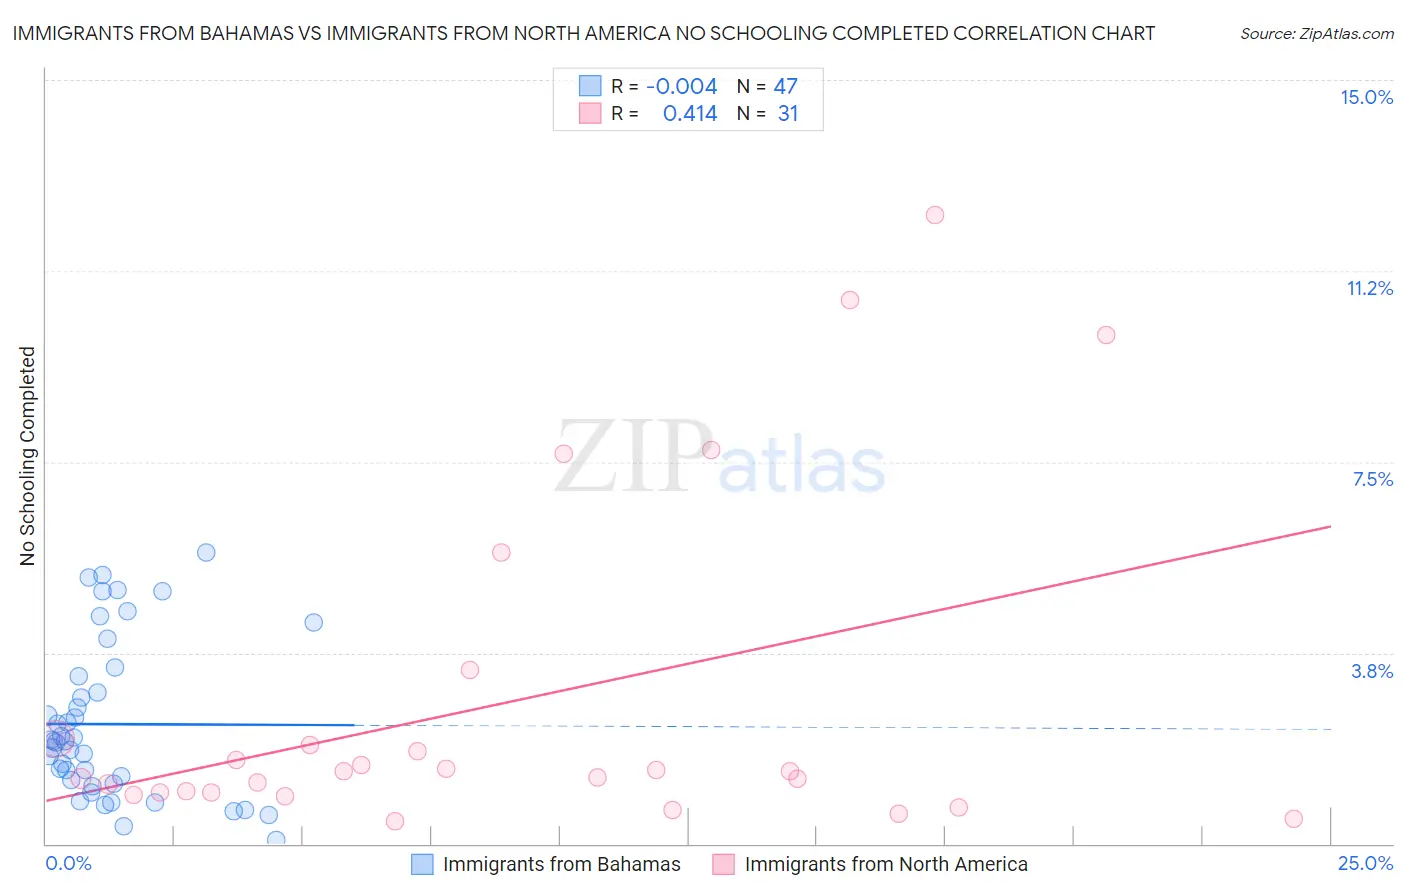
Immigrants from Bahamas vs Immigrants from North America No Schooling Completed Correlation Chart
The statistical analysis conducted on geographies consisting of 104,436,270 people shows no correlation between the proportion of Immigrants from Bahamas and percentage of population with no schooling in the United States with a correlation coefficient (R) of -0.004 and weighted average of 2.2%. Similarly, the statistical analysis conducted on geographies consisting of 454,496,769 people shows a moderate positive correlation between the proportion of Immigrants from North America and percentage of population with no schooling in the United States with a correlation coefficient (R) of 0.414 and weighted average of 1.6%, a difference of 36.1%.
No Schooling Completed Correlation Summary
| Measurement | Immigrants from Bahamas | Immigrants from North America |
| Minimum | 0.079% | 0.45% |
| Maximum | 5.7% | 12.4% |
| Range | 5.6% | 11.9% |
| Mean | 2.3% | 2.8% |
| Median | 2.0% | 1.4% |
| Interquartile 25% (IQ1) | 1.2% | 1.00% |
| Interquartile 75% (IQ3) | 3.3% | 2.1% |
| Interquartile Range (IQR) | 2.1% | 1.1% |
| Standard Deviation (Sample) | 1.5% | 3.3% |
| Standard Deviation (Population) | 1.5% | 3.3% |
Similar Demographics by No Schooling Completed
Demographics Similar to Immigrants from Bahamas by No Schooling Completed
In terms of no schooling completed, the demographic groups most similar to Immigrants from Bahamas are Bahamian (2.2%, a difference of 0.010%), South American Indian (2.2%, a difference of 0.19%), Uruguayan (2.2%, a difference of 0.19%), Hopi (2.2%, a difference of 0.40%), and Immigrants from Oceania (2.2%, a difference of 0.45%).
| Demographics | Rating | Rank | No Schooling Completed |
| Immigrants | Chile | 22.7 /100 | #198 | Fair 2.2% |
| Africans | 21.8 /100 | #199 | Fair 2.2% |
| Immigrants | Northern Africa | 19.5 /100 | #200 | Poor 2.2% |
| Costa Ricans | 17.1 /100 | #201 | Poor 2.2% |
| Moroccans | 13.7 /100 | #202 | Poor 2.2% |
| Laotians | 13.3 /100 | #203 | Poor 2.2% |
| Hopi | 12.9 /100 | #204 | Poor 2.2% |
| Immigrants | Bahamas | 11.6 /100 | #205 | Poor 2.2% |
| Bahamians | 11.6 /100 | #206 | Poor 2.2% |
| South American Indians | 11.0 /100 | #207 | Poor 2.2% |
| Uruguayans | 11.0 /100 | #208 | Poor 2.2% |
| Immigrants | Oceania | 10.2 /100 | #209 | Poor 2.2% |
| Natives/Alaskans | 10.0 /100 | #210 | Tragic 2.2% |
| Immigrants | Panama | 8.8 /100 | #211 | Tragic 2.3% |
| Immigrants | Morocco | 8.7 /100 | #212 | Tragic 2.3% |
Demographics Similar to Immigrants from North America by No Schooling Completed
In terms of no schooling completed, the demographic groups most similar to Immigrants from North America are Greek (1.6%, a difference of 0.0%), Crow (1.6%, a difference of 0.12%), Creek (1.6%, a difference of 0.15%), Immigrants from Canada (1.6%, a difference of 0.28%), and Austrian (1.6%, a difference of 0.31%).
| Demographics | Rating | Rank | No Schooling Completed |
| Whites/Caucasians | 99.9 /100 | #49 | Exceptional 1.6% |
| Celtics | 99.9 /100 | #50 | Exceptional 1.6% |
| Chippewa | 99.8 /100 | #51 | Exceptional 1.6% |
| Immigrants | Canada | 99.8 /100 | #52 | Exceptional 1.6% |
| Creek | 99.8 /100 | #53 | Exceptional 1.6% |
| Crow | 99.8 /100 | #54 | Exceptional 1.6% |
| Greeks | 99.8 /100 | #55 | Exceptional 1.6% |
| Immigrants | North America | 99.8 /100 | #56 | Exceptional 1.6% |
| Austrians | 99.8 /100 | #57 | Exceptional 1.6% |
| Kiowa | 99.8 /100 | #58 | Exceptional 1.6% |
| Slavs | 99.8 /100 | #59 | Exceptional 1.7% |
| Americans | 99.8 /100 | #60 | Exceptional 1.7% |
| Tsimshian | 99.8 /100 | #61 | Exceptional 1.7% |
| Immigrants | Northern Europe | 99.8 /100 | #62 | Exceptional 1.7% |
| Russians | 99.8 /100 | #63 | Exceptional 1.7% |