Immigrants from Micronesia vs Marshallese 3rd Grade
COMPARE
Immigrants from Micronesia
Marshallese
3rd Grade
3rd Grade Comparison
Immigrants from Micronesia
Marshallese
97.8%
3RD GRADE
47.6/ 100
METRIC RATING
175th/ 347
METRIC RANK
97.8%
3RD GRADE
57.2/ 100
METRIC RATING
163rd/ 347
METRIC RANK
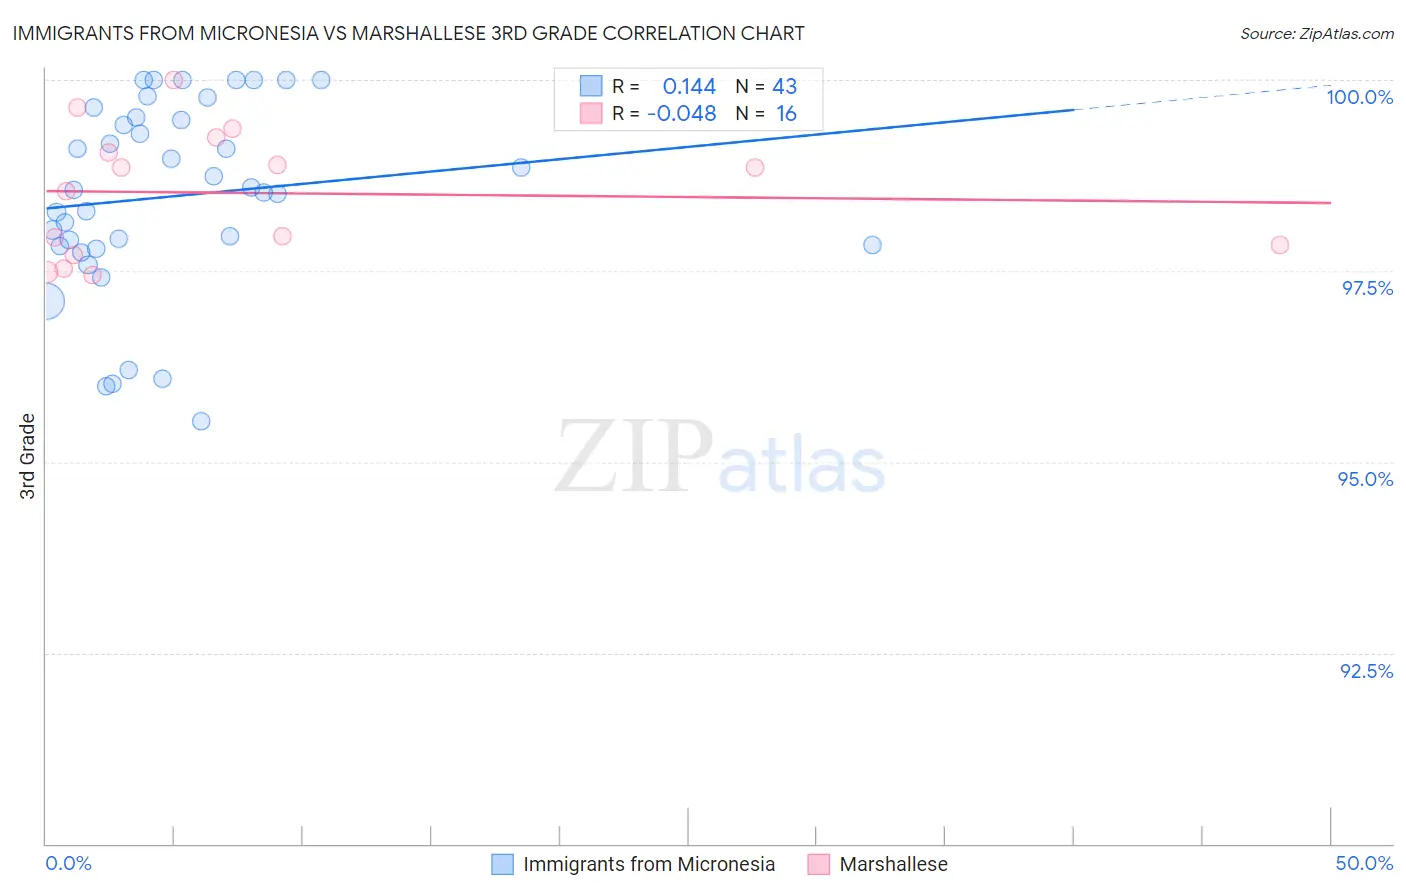
Immigrants from Micronesia vs Marshallese 3rd Grade Correlation Chart
The statistical analysis conducted on geographies consisting of 61,604,657 people shows a poor positive correlation between the proportion of Immigrants from Micronesia and percentage of population with at least 3rd grade education in the United States with a correlation coefficient (R) of 0.144 and weighted average of 97.8%. Similarly, the statistical analysis conducted on geographies consisting of 14,761,315 people shows no correlation between the proportion of Marshallese and percentage of population with at least 3rd grade education in the United States with a correlation coefficient (R) of -0.048 and weighted average of 97.8%, a difference of 0.030%.
3rd Grade Correlation Summary
| Measurement | Immigrants from Micronesia | Marshallese |
| Minimum | 95.5% | 97.4% |
| Maximum | 100.0% | 100.0% |
| Range | 4.5% | 2.6% |
| Mean | 98.5% | 98.5% |
| Median | 98.6% | 98.7% |
| Interquartile 25% (IQ1) | 97.8% | 97.8% |
| Interquartile 75% (IQ3) | 99.5% | 99.1% |
| Interquartile Range (IQR) | 1.7% | 1.4% |
| Standard Deviation (Sample) | 1.2% | 0.83% |
| Standard Deviation (Population) | 1.2% | 0.80% |
Demographics Similar to Immigrants from Micronesia and Marshallese by 3rd Grade
In terms of 3rd grade, the demographic groups most similar to Immigrants from Micronesia are Immigrants from Poland (97.8%, a difference of 0.0%), Egyptian (97.7%, a difference of 0.0%), Immigrants from Brazil (97.7%, a difference of 0.0%), Kenyan (97.8%, a difference of 0.010%), and Spanish American (97.8%, a difference of 0.010%). Similarly, the demographic groups most similar to Marshallese are Immigrants from Jordan (97.8%, a difference of 0.0%), Immigrants from Bosnia and Herzegovina (97.8%, a difference of 0.0%), Ugandan (97.8%, a difference of 0.0%), French American Indian (97.8%, a difference of 0.010%), and Immigrants from Iran (97.8%, a difference of 0.010%).
| Demographics | Rating | Rank | 3rd Grade |
| French American Indians | 60.0 /100 | #159 | Average 97.8% |
| Immigrants | Iran | 59.1 /100 | #160 | Average 97.8% |
| Albanians | 58.8 /100 | #161 | Average 97.8% |
| Immigrants | Jordan | 57.9 /100 | #162 | Average 97.8% |
| Marshallese | 57.2 /100 | #163 | Average 97.8% |
| Immigrants | Bosnia and Herzegovina | 56.2 /100 | #164 | Average 97.8% |
| Ugandans | 56.1 /100 | #165 | Average 97.8% |
| Dutch West Indians | 55.5 /100 | #166 | Average 97.8% |
| Chileans | 55.3 /100 | #167 | Average 97.8% |
| Immigrants | Spain | 54.3 /100 | #168 | Average 97.8% |
| Comanche | 53.8 /100 | #169 | Average 97.8% |
| Brazilians | 53.7 /100 | #170 | Average 97.8% |
| Kenyans | 51.8 /100 | #171 | Average 97.8% |
| Spanish Americans | 51.8 /100 | #172 | Average 97.8% |
| Immigrants | Korea | 50.9 /100 | #173 | Average 97.8% |
| Navajo | 50.0 /100 | #174 | Average 97.8% |
| Immigrants | Micronesia | 47.6 /100 | #175 | Average 97.8% |
| Immigrants | Poland | 47.1 /100 | #176 | Average 97.8% |
| Egyptians | 46.6 /100 | #177 | Average 97.7% |
| Immigrants | Brazil | 46.4 /100 | #178 | Average 97.7% |
| Immigrants | Belarus | 45.9 /100 | #179 | Average 97.7% |