Welsh vs Filipino 3rd Grade
COMPARE
Welsh
Filipino
3rd Grade
3rd Grade Comparison
Welsh
Filipinos
98.8%
3RD GRADE
100.0/ 100
METRIC RATING
3rd/ 347
METRIC RANK
97.9%
3RD GRADE
79.9/ 100
METRIC RATING
143rd/ 347
METRIC RANK
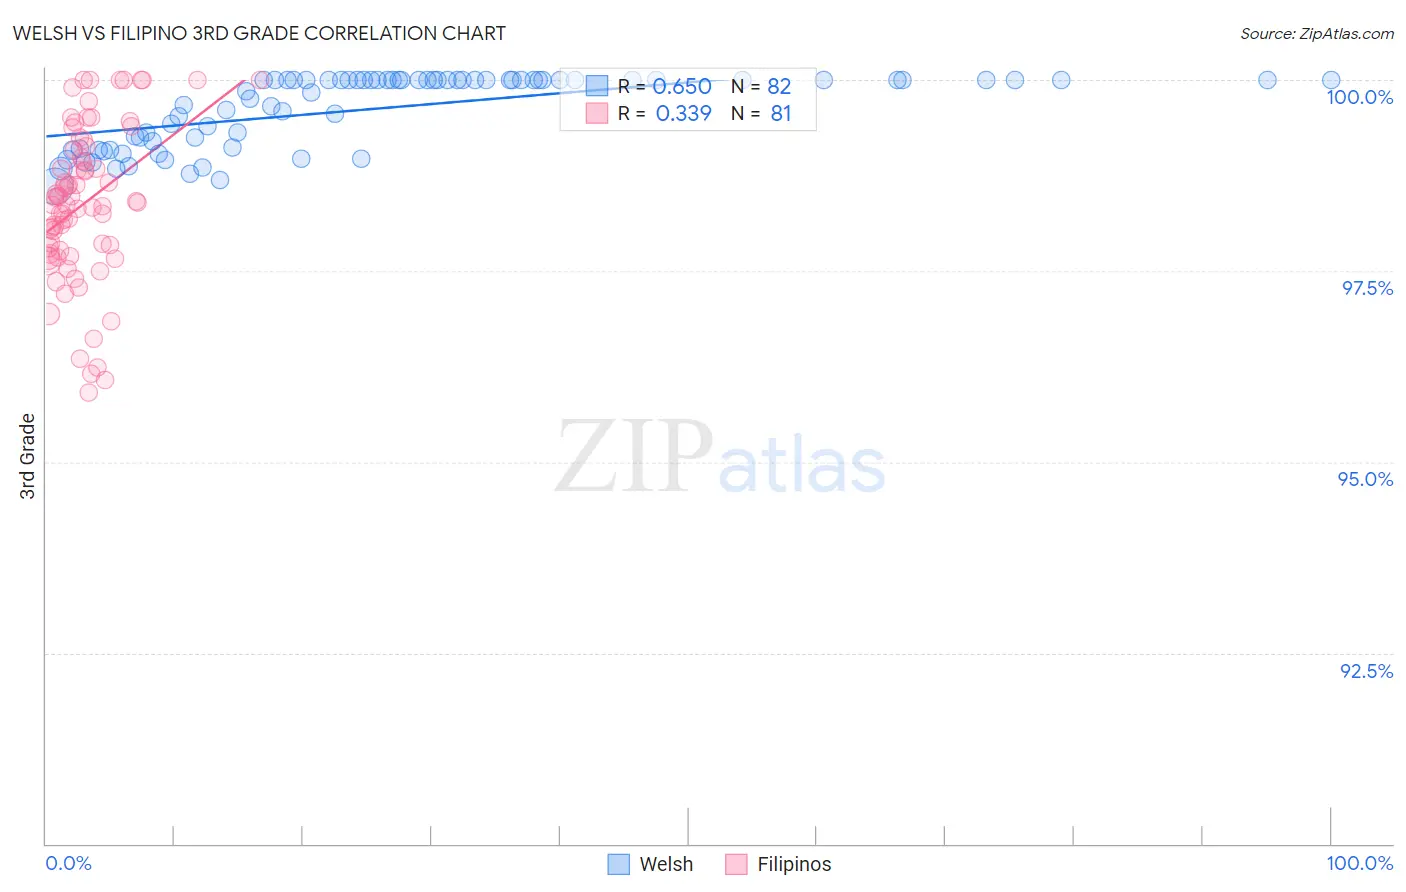
Welsh vs Filipino 3rd Grade Correlation Chart
The statistical analysis conducted on geographies consisting of 239,959,962 people shows a significant positive correlation between the proportion of Welsh and percentage of population with at least 3rd grade education in the United States with a correlation coefficient (R) of 0.650 and weighted average of 98.8%. Similarly, the statistical analysis conducted on geographies consisting of 254,351,427 people shows a mild positive correlation between the proportion of Filipinos and percentage of population with at least 3rd grade education in the United States with a correlation coefficient (R) of 0.339 and weighted average of 97.9%, a difference of 0.93%.
3rd Grade Correlation Summary
| Measurement | Welsh | Filipino |
| Minimum | 98.6% | 95.9% |
| Maximum | 100.0% | 100.0% |
| Range | 1.4% | 4.1% |
| Mean | 99.6% | 98.4% |
| Median | 100.0% | 98.4% |
| Interquartile 25% (IQ1) | 99.1% | 97.7% |
| Interquartile 75% (IQ3) | 100.0% | 99.1% |
| Interquartile Range (IQR) | 0.89% | 1.4% |
| Standard Deviation (Sample) | 0.46% | 1.0% |
| Standard Deviation (Population) | 0.46% | 1.0% |
Similar Demographics by 3rd Grade
Demographics Similar to Welsh by 3rd Grade
In terms of 3rd grade, the demographic groups most similar to Welsh are Inupiat (98.8%, a difference of 0.030%), Tsimshian (98.8%, a difference of 0.040%), Alaskan Athabascan (98.7%, a difference of 0.13%), Norwegian (98.6%, a difference of 0.17%), and Slovak (98.6%, a difference of 0.19%).
| Demographics | Rating | Rank | 3rd Grade |
| Crow | 100.0 /100 | #1 | Exceptional 99.6% |
| Yup'ik | 100.0 /100 | #2 | Exceptional 99.0% |
| Welsh | 100.0 /100 | #3 | Exceptional 98.8% |
| Inupiat | 100.0 /100 | #4 | Exceptional 98.8% |
| Tsimshian | 100.0 /100 | #5 | Exceptional 98.8% |
| Alaskan Athabascans | 100.0 /100 | #6 | Exceptional 98.7% |
| Norwegians | 100.0 /100 | #7 | Exceptional 98.6% |
| Slovaks | 100.0 /100 | #8 | Exceptional 98.6% |
| Germans | 100.0 /100 | #9 | Exceptional 98.6% |
| Alaska Natives | 100.0 /100 | #10 | Exceptional 98.6% |
| Slovenes | 100.0 /100 | #11 | Exceptional 98.6% |
| English | 100.0 /100 | #12 | Exceptional 98.6% |
| Tlingit-Haida | 100.0 /100 | #13 | Exceptional 98.5% |
| Carpatho Rusyns | 100.0 /100 | #14 | Exceptional 98.5% |
| Swedes | 100.0 /100 | #15 | Exceptional 98.5% |
Demographics Similar to Filipinos by 3rd Grade
In terms of 3rd grade, the demographic groups most similar to Filipinos are Hmong (97.9%, a difference of 0.0%), Burmese (97.9%, a difference of 0.0%), Immigrants from Greece (97.9%, a difference of 0.0%), Alsatian (97.9%, a difference of 0.010%), and Immigrants from Israel (97.9%, a difference of 0.010%).
| Demographics | Rating | Rank | 3rd Grade |
| Spaniards | 87.9 /100 | #136 | Excellent 97.9% |
| Immigrants | Romania | 87.9 /100 | #137 | Excellent 97.9% |
| Israelis | 86.6 /100 | #138 | Excellent 97.9% |
| Blackfeet | 86.3 /100 | #139 | Excellent 97.9% |
| Palestinians | 84.6 /100 | #140 | Excellent 97.9% |
| Immigrants | Turkey | 83.5 /100 | #141 | Excellent 97.9% |
| Hmong | 80.3 /100 | #142 | Excellent 97.9% |
| Filipinos | 79.9 /100 | #143 | Good 97.9% |
| Burmese | 79.6 /100 | #144 | Good 97.9% |
| Immigrants | Greece | 79.5 /100 | #145 | Good 97.9% |
| Alsatians | 78.3 /100 | #146 | Good 97.9% |
| Immigrants | Israel | 77.3 /100 | #147 | Good 97.9% |
| Immigrants | Moldova | 77.1 /100 | #148 | Good 97.9% |
| Immigrants | North Macedonia | 74.5 /100 | #149 | Good 97.8% |
| Jordanians | 74.5 /100 | #150 | Good 97.8% |