Vietnamese vs Nepalese 5th Grade
COMPARE
Vietnamese
Nepalese
5th Grade
5th Grade Comparison
Vietnamese
Nepalese
95.9%
5TH GRADE
0.0/ 100
METRIC RATING
312th/ 347
METRIC RANK
95.2%
5TH GRADE
0.0/ 100
METRIC RATING
334th/ 347
METRIC RANK
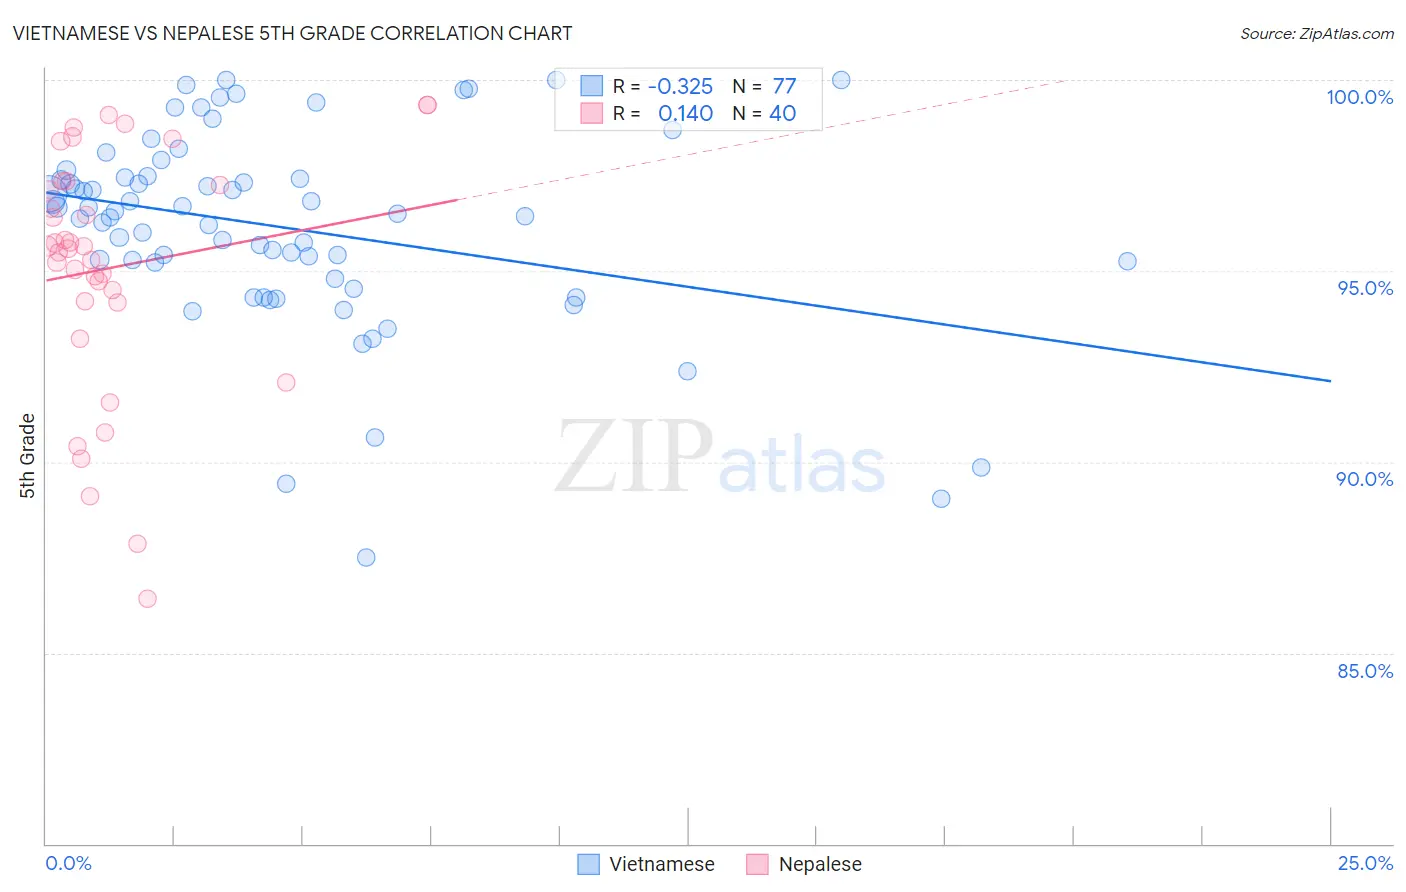
Vietnamese vs Nepalese 5th Grade Correlation Chart
The statistical analysis conducted on geographies consisting of 170,728,240 people shows a mild negative correlation between the proportion of Vietnamese and percentage of population with at least 5th grade education in the United States with a correlation coefficient (R) of -0.325 and weighted average of 95.9%. Similarly, the statistical analysis conducted on geographies consisting of 24,521,755 people shows a poor positive correlation between the proportion of Nepalese and percentage of population with at least 5th grade education in the United States with a correlation coefficient (R) of 0.140 and weighted average of 95.2%, a difference of 0.72%.
5th Grade Correlation Summary
| Measurement | Vietnamese | Nepalese |
| Minimum | 87.5% | 86.4% |
| Maximum | 100.0% | 99.3% |
| Range | 12.5% | 12.9% |
| Mean | 96.1% | 95.1% |
| Median | 96.5% | 95.6% |
| Interquartile 25% (IQ1) | 95.0% | 94.2% |
| Interquartile 75% (IQ3) | 97.5% | 97.3% |
| Interquartile Range (IQR) | 2.5% | 3.1% |
| Standard Deviation (Sample) | 2.6% | 3.2% |
| Standard Deviation (Population) | 2.6% | 3.2% |
Similar Demographics by 5th Grade
Demographics Similar to Vietnamese by 5th Grade
In terms of 5th grade, the demographic groups most similar to Vietnamese are Bangladeshi (95.9%, a difference of 0.020%), Immigrants from Portugal (95.9%, a difference of 0.020%), Immigrants from Bangladesh (96.0%, a difference of 0.030%), Nicaraguan (95.9%, a difference of 0.040%), and Indonesian (96.0%, a difference of 0.050%).
| Demographics | Rating | Rank | 5th Grade |
| Immigrants | Laos | 0.0 /100 | #305 | Tragic 96.0% |
| Immigrants | Haiti | 0.0 /100 | #306 | Tragic 96.0% |
| Immigrants | Caribbean | 0.0 /100 | #307 | Tragic 96.0% |
| Ecuadorians | 0.0 /100 | #308 | Tragic 96.0% |
| Immigrants | Guyana | 0.0 /100 | #309 | Tragic 96.0% |
| Indonesians | 0.0 /100 | #310 | Tragic 96.0% |
| Immigrants | Bangladesh | 0.0 /100 | #311 | Tragic 96.0% |
| Vietnamese | 0.0 /100 | #312 | Tragic 95.9% |
| Bangladeshis | 0.0 /100 | #313 | Tragic 95.9% |
| Immigrants | Portugal | 0.0 /100 | #314 | Tragic 95.9% |
| Nicaraguans | 0.0 /100 | #315 | Tragic 95.9% |
| Immigrants | Ecuador | 0.0 /100 | #316 | Tragic 95.8% |
| Belizeans | 0.0 /100 | #317 | Tragic 95.8% |
| Immigrants | Vietnam | 0.0 /100 | #318 | Tragic 95.8% |
| Japanese | 0.0 /100 | #319 | Tragic 95.7% |
Demographics Similar to Nepalese by 5th Grade
In terms of 5th grade, the demographic groups most similar to Nepalese are Immigrants from Dominican Republic (95.3%, a difference of 0.030%), Immigrants from Latin America (95.3%, a difference of 0.030%), Mexican (95.2%, a difference of 0.030%), Immigrants from the Azores (95.1%, a difference of 0.13%), and Immigrants from Honduras (95.4%, a difference of 0.14%).
| Demographics | Rating | Rank | 5th Grade |
| Dominicans | 0.0 /100 | #327 | Tragic 95.5% |
| Cape Verdeans | 0.0 /100 | #328 | Tragic 95.5% |
| Mexican American Indians | 0.0 /100 | #329 | Tragic 95.5% |
| Immigrants | Armenia | 0.0 /100 | #330 | Tragic 95.4% |
| Immigrants | Honduras | 0.0 /100 | #331 | Tragic 95.4% |
| Immigrants | Dominican Republic | 0.0 /100 | #332 | Tragic 95.3% |
| Immigrants | Latin America | 0.0 /100 | #333 | Tragic 95.3% |
| Nepalese | 0.0 /100 | #334 | Tragic 95.2% |
| Mexicans | 0.0 /100 | #335 | Tragic 95.2% |
| Immigrants | Azores | 0.0 /100 | #336 | Tragic 95.1% |
| Central Americans | 0.0 /100 | #337 | Tragic 95.1% |
| Immigrants | Cabo Verde | 0.0 /100 | #338 | Tragic 94.9% |
| Immigrants | Yemen | 0.0 /100 | #339 | Tragic 94.9% |
| Guatemalans | 0.0 /100 | #340 | Tragic 94.8% |
| Yakama | 0.0 /100 | #341 | Tragic 94.8% |