U.S. Virgin Islander vs Nepalese 5th Grade
COMPARE
U.S. Virgin Islander
Nepalese
5th Grade
5th Grade Comparison
U.S. Virgin Islanders
Nepalese
96.9%
5TH GRADE
1.1/ 100
METRIC RATING
248th/ 347
METRIC RANK
95.2%
5TH GRADE
0.0/ 100
METRIC RATING
334th/ 347
METRIC RANK
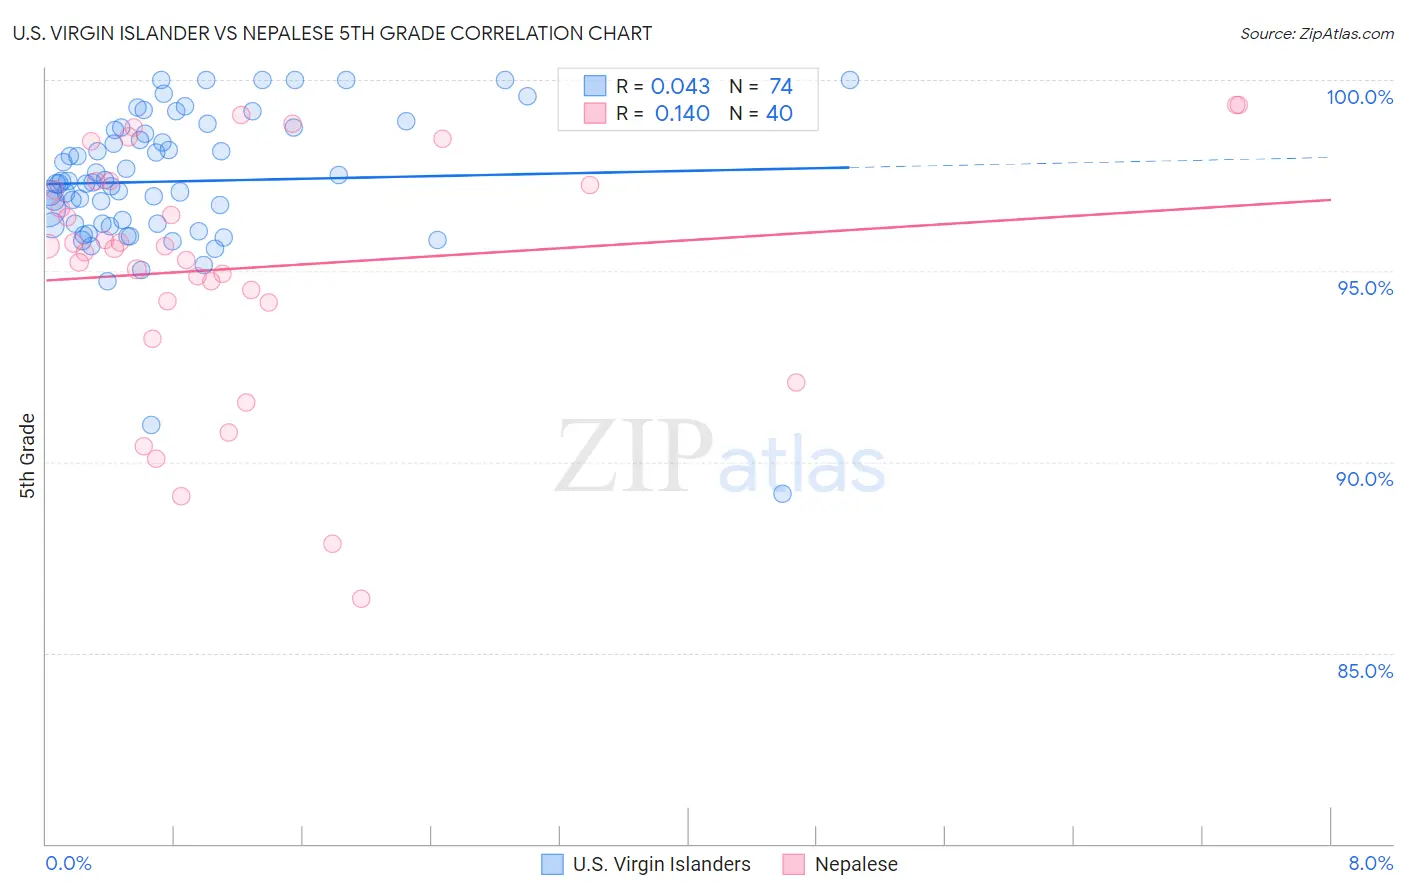
U.S. Virgin Islander vs Nepalese 5th Grade Correlation Chart
The statistical analysis conducted on geographies consisting of 87,529,315 people shows no correlation between the proportion of U.S. Virgin Islanders and percentage of population with at least 5th grade education in the United States with a correlation coefficient (R) of 0.043 and weighted average of 96.9%. Similarly, the statistical analysis conducted on geographies consisting of 24,521,755 people shows a poor positive correlation between the proportion of Nepalese and percentage of population with at least 5th grade education in the United States with a correlation coefficient (R) of 0.140 and weighted average of 95.2%, a difference of 1.7%.
5th Grade Correlation Summary
| Measurement | U.S. Virgin Islander | Nepalese |
| Minimum | 89.2% | 86.4% |
| Maximum | 100.0% | 99.3% |
| Range | 10.8% | 12.9% |
| Mean | 97.3% | 95.1% |
| Median | 97.3% | 95.6% |
| Interquartile 25% (IQ1) | 96.2% | 94.2% |
| Interquartile 75% (IQ3) | 98.7% | 97.3% |
| Interquartile Range (IQR) | 2.5% | 3.1% |
| Standard Deviation (Sample) | 1.9% | 3.2% |
| Standard Deviation (Population) | 1.9% | 3.2% |
Similar Demographics by 5th Grade
Demographics Similar to U.S. Virgin Islanders by 5th Grade
In terms of 5th grade, the demographic groups most similar to U.S. Virgin Islanders are Immigrants from Africa (96.9%, a difference of 0.0%), Ethiopian (96.9%, a difference of 0.010%), Immigrants from Uruguay (96.9%, a difference of 0.010%), Immigrants from Liberia (96.9%, a difference of 0.010%), and Bolivian (96.9%, a difference of 0.010%).
| Demographics | Rating | Rank | 5th Grade |
| Immigrants | Asia | 1.7 /100 | #241 | Tragic 96.9% |
| Immigrants | Costa Rica | 1.6 /100 | #242 | Tragic 96.9% |
| Immigrants | Eastern Africa | 1.6 /100 | #243 | Tragic 96.9% |
| Koreans | 1.6 /100 | #244 | Tragic 96.9% |
| Colombians | 1.3 /100 | #245 | Tragic 96.9% |
| Ethiopians | 1.2 /100 | #246 | Tragic 96.9% |
| Immigrants | Africa | 1.1 /100 | #247 | Tragic 96.9% |
| U.S. Virgin Islanders | 1.1 /100 | #248 | Tragic 96.9% |
| Immigrants | Uruguay | 1.0 /100 | #249 | Tragic 96.9% |
| Immigrants | Liberia | 1.0 /100 | #250 | Tragic 96.9% |
| Bolivians | 0.9 /100 | #251 | Tragic 96.9% |
| Jamaicans | 0.9 /100 | #252 | Tragic 96.9% |
| Immigrants | Middle Africa | 0.8 /100 | #253 | Tragic 96.8% |
| Immigrants | Senegal | 0.8 /100 | #254 | Tragic 96.8% |
| South Americans | 0.7 /100 | #255 | Tragic 96.8% |
Demographics Similar to Nepalese by 5th Grade
In terms of 5th grade, the demographic groups most similar to Nepalese are Immigrants from Dominican Republic (95.3%, a difference of 0.030%), Immigrants from Latin America (95.3%, a difference of 0.030%), Mexican (95.2%, a difference of 0.030%), Immigrants from the Azores (95.1%, a difference of 0.13%), and Immigrants from Honduras (95.4%, a difference of 0.14%).
| Demographics | Rating | Rank | 5th Grade |
| Dominicans | 0.0 /100 | #327 | Tragic 95.5% |
| Cape Verdeans | 0.0 /100 | #328 | Tragic 95.5% |
| Mexican American Indians | 0.0 /100 | #329 | Tragic 95.5% |
| Immigrants | Armenia | 0.0 /100 | #330 | Tragic 95.4% |
| Immigrants | Honduras | 0.0 /100 | #331 | Tragic 95.4% |
| Immigrants | Dominican Republic | 0.0 /100 | #332 | Tragic 95.3% |
| Immigrants | Latin America | 0.0 /100 | #333 | Tragic 95.3% |
| Nepalese | 0.0 /100 | #334 | Tragic 95.2% |
| Mexicans | 0.0 /100 | #335 | Tragic 95.2% |
| Immigrants | Azores | 0.0 /100 | #336 | Tragic 95.1% |
| Central Americans | 0.0 /100 | #337 | Tragic 95.1% |
| Immigrants | Cabo Verde | 0.0 /100 | #338 | Tragic 94.9% |
| Immigrants | Yemen | 0.0 /100 | #339 | Tragic 94.9% |
| Guatemalans | 0.0 /100 | #340 | Tragic 94.8% |
| Yakama | 0.0 /100 | #341 | Tragic 94.8% |