Vietnamese vs Navajo 5th Grade
COMPARE
Vietnamese
Navajo
5th Grade
5th Grade Comparison
Vietnamese
Navajo
95.9%
5TH GRADE
0.0/ 100
METRIC RATING
312th/ 347
METRIC RANK
97.2%
5TH GRADE
29.0/ 100
METRIC RATING
193rd/ 347
METRIC RANK
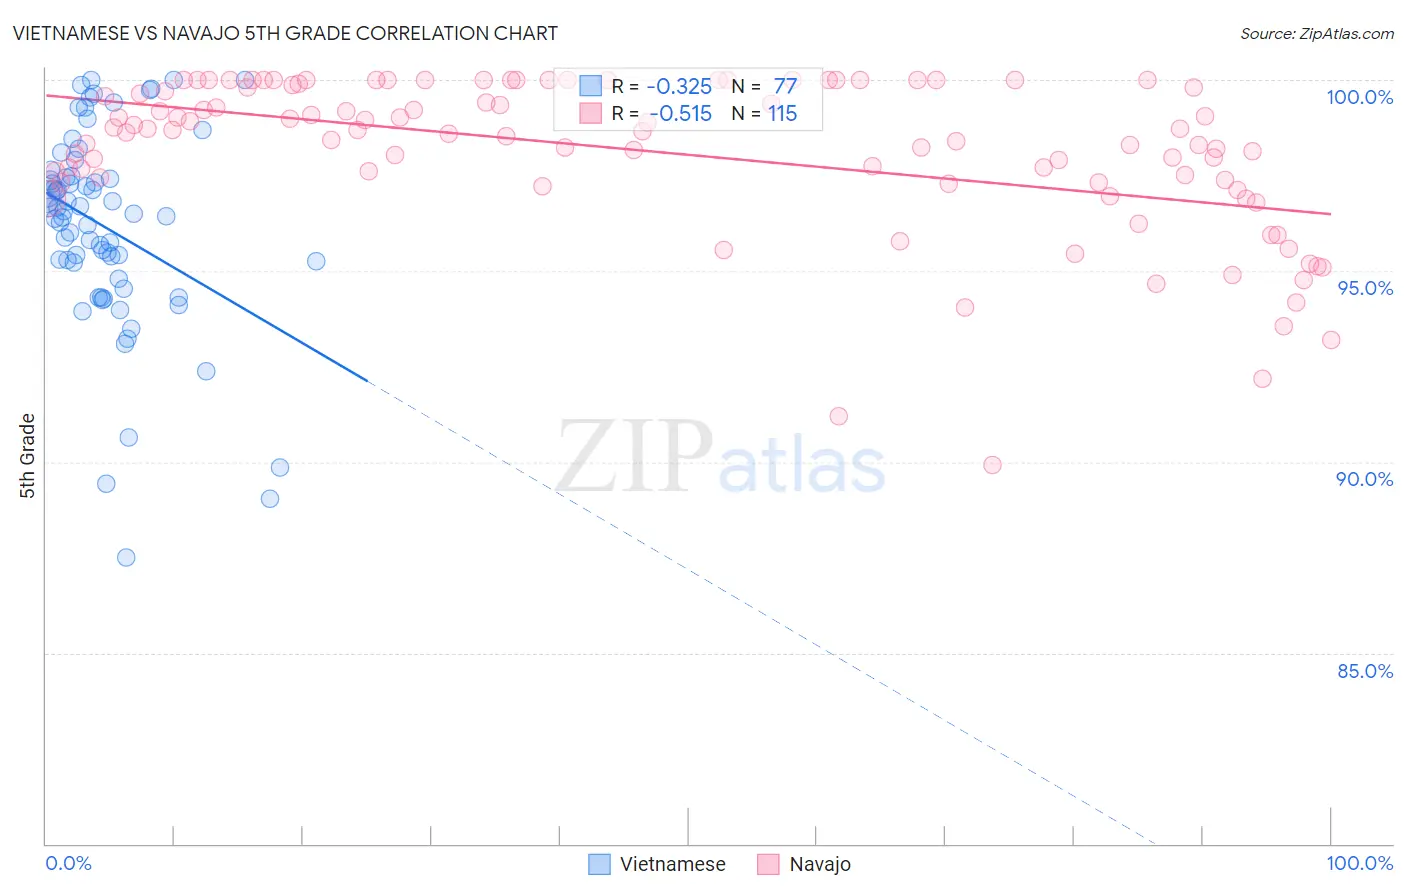
Vietnamese vs Navajo 5th Grade Correlation Chart
The statistical analysis conducted on geographies consisting of 170,728,240 people shows a mild negative correlation between the proportion of Vietnamese and percentage of population with at least 5th grade education in the United States with a correlation coefficient (R) of -0.325 and weighted average of 95.9%. Similarly, the statistical analysis conducted on geographies consisting of 224,872,927 people shows a substantial negative correlation between the proportion of Navajo and percentage of population with at least 5th grade education in the United States with a correlation coefficient (R) of -0.515 and weighted average of 97.2%, a difference of 1.4%.
5th Grade Correlation Summary
| Measurement | Vietnamese | Navajo |
| Minimum | 87.5% | 89.9% |
| Maximum | 100.0% | 100.0% |
| Range | 12.5% | 10.1% |
| Mean | 96.1% | 98.1% |
| Median | 96.5% | 98.7% |
| Interquartile 25% (IQ1) | 95.0% | 97.3% |
| Interquartile 75% (IQ3) | 97.5% | 99.9% |
| Interquartile Range (IQR) | 2.5% | 2.6% |
| Standard Deviation (Sample) | 2.6% | 2.0% |
| Standard Deviation (Population) | 2.6% | 2.0% |
Similar Demographics by 5th Grade
Demographics Similar to Vietnamese by 5th Grade
In terms of 5th grade, the demographic groups most similar to Vietnamese are Bangladeshi (95.9%, a difference of 0.020%), Immigrants from Portugal (95.9%, a difference of 0.020%), Immigrants from Bangladesh (96.0%, a difference of 0.030%), Nicaraguan (95.9%, a difference of 0.040%), and Indonesian (96.0%, a difference of 0.050%).
| Demographics | Rating | Rank | 5th Grade |
| Immigrants | Laos | 0.0 /100 | #305 | Tragic 96.0% |
| Immigrants | Haiti | 0.0 /100 | #306 | Tragic 96.0% |
| Immigrants | Caribbean | 0.0 /100 | #307 | Tragic 96.0% |
| Ecuadorians | 0.0 /100 | #308 | Tragic 96.0% |
| Immigrants | Guyana | 0.0 /100 | #309 | Tragic 96.0% |
| Indonesians | 0.0 /100 | #310 | Tragic 96.0% |
| Immigrants | Bangladesh | 0.0 /100 | #311 | Tragic 96.0% |
| Vietnamese | 0.0 /100 | #312 | Tragic 95.9% |
| Bangladeshis | 0.0 /100 | #313 | Tragic 95.9% |
| Immigrants | Portugal | 0.0 /100 | #314 | Tragic 95.9% |
| Nicaraguans | 0.0 /100 | #315 | Tragic 95.9% |
| Immigrants | Ecuador | 0.0 /100 | #316 | Tragic 95.8% |
| Belizeans | 0.0 /100 | #317 | Tragic 95.8% |
| Immigrants | Vietnam | 0.0 /100 | #318 | Tragic 95.8% |
| Japanese | 0.0 /100 | #319 | Tragic 95.7% |
Demographics Similar to Navajo by 5th Grade
In terms of 5th grade, the demographic groups most similar to Navajo are Immigrants from Albania (97.2%, a difference of 0.0%), Black/African American (97.3%, a difference of 0.010%), Immigrants from Brazil (97.3%, a difference of 0.010%), Panamanian (97.3%, a difference of 0.010%), and Guamanian/Chamorro (97.2%, a difference of 0.010%).
| Demographics | Rating | Rank | 5th Grade |
| Immigrants | Argentina | 36.1 /100 | #186 | Fair 97.3% |
| Spanish Americans | 34.7 /100 | #187 | Fair 97.3% |
| Paraguayans | 33.7 /100 | #188 | Fair 97.3% |
| Immigrants | Egypt | 32.9 /100 | #189 | Fair 97.3% |
| Blacks/African Americans | 31.8 /100 | #190 | Fair 97.3% |
| Immigrants | Brazil | 31.5 /100 | #191 | Fair 97.3% |
| Panamanians | 31.3 /100 | #192 | Fair 97.3% |
| Navajo | 29.0 /100 | #193 | Fair 97.2% |
| Immigrants | Albania | 28.5 /100 | #194 | Fair 97.2% |
| Guamanians/Chamorros | 26.8 /100 | #195 | Fair 97.2% |
| Hawaiians | 25.6 /100 | #196 | Fair 97.2% |
| Brazilians | 25.4 /100 | #197 | Fair 97.2% |
| Immigrants | Uganda | 21.1 /100 | #198 | Fair 97.2% |
| Natives/Alaskans | 18.0 /100 | #199 | Poor 97.2% |
| Immigrants | Northern Africa | 16.8 /100 | #200 | Poor 97.2% |