Vietnamese vs Dutch West Indian 7th Grade
COMPARE
Vietnamese
Dutch West Indian
7th Grade
7th Grade Comparison
Vietnamese
Dutch West Indians
93.9%
7TH GRADE
0.0/ 100
METRIC RATING
315th/ 347
METRIC RANK
95.8%
7TH GRADE
16.1/ 100
METRIC RATING
209th/ 347
METRIC RANK
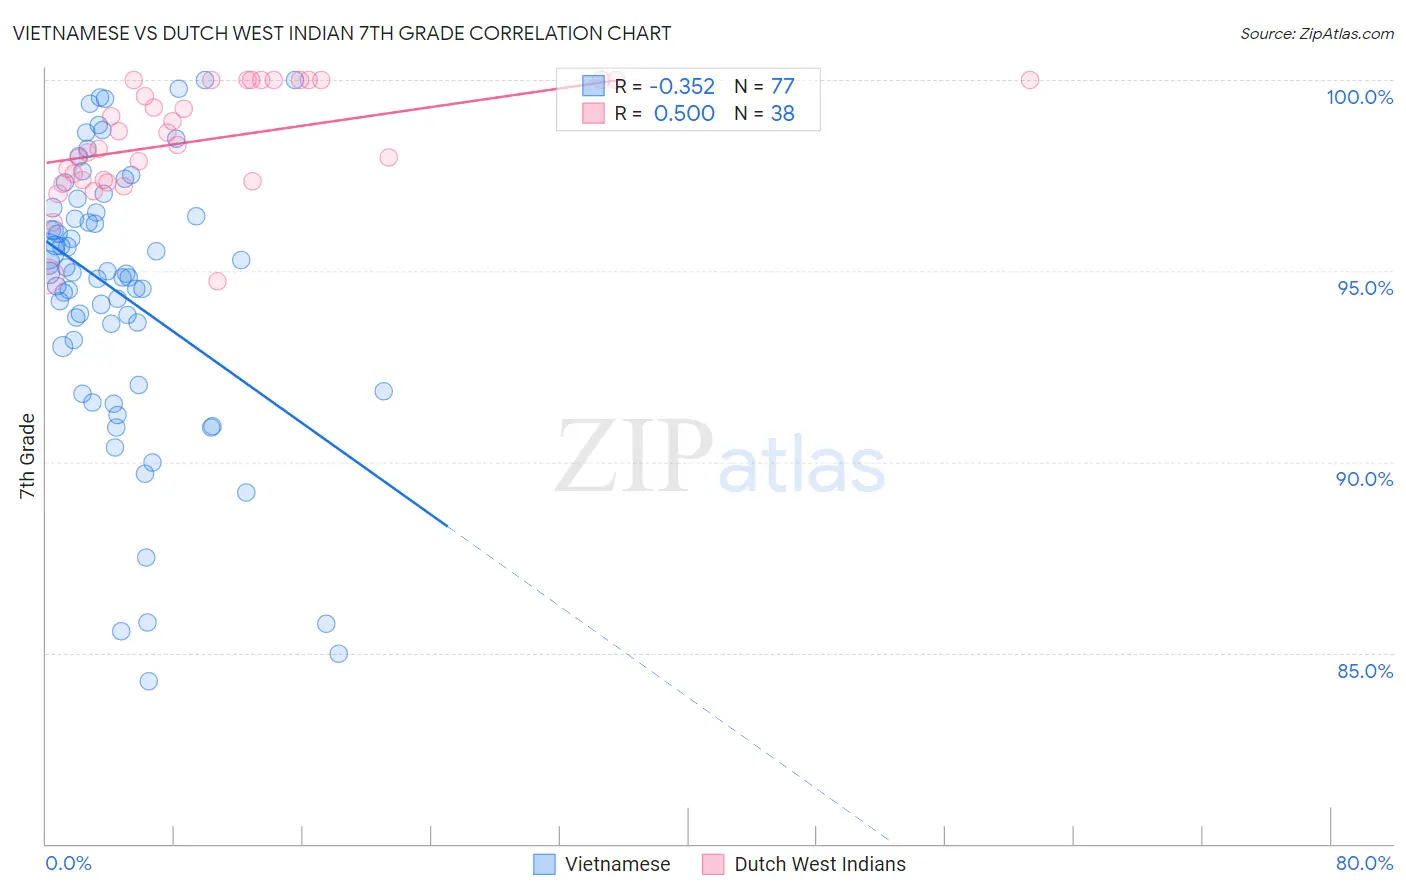
Vietnamese vs Dutch West Indian 7th Grade Correlation Chart
The statistical analysis conducted on geographies consisting of 170,728,240 people shows a mild negative correlation between the proportion of Vietnamese and percentage of population with at least 7th grade education in the United States with a correlation coefficient (R) of -0.352 and weighted average of 93.9%. Similarly, the statistical analysis conducted on geographies consisting of 85,775,604 people shows a substantial positive correlation between the proportion of Dutch West Indians and percentage of population with at least 7th grade education in the United States with a correlation coefficient (R) of 0.500 and weighted average of 95.8%, a difference of 2.0%.
7th Grade Correlation Summary
| Measurement | Vietnamese | Dutch West Indian |
| Minimum | 84.3% | 94.7% |
| Maximum | 100.0% | 100.0% |
| Range | 15.7% | 5.3% |
| Mean | 94.4% | 98.4% |
| Median | 95.0% | 98.5% |
| Interquartile 25% (IQ1) | 92.5% | 97.4% |
| Interquartile 75% (IQ3) | 96.6% | 100.0% |
| Interquartile Range (IQR) | 4.1% | 2.6% |
| Standard Deviation (Sample) | 3.6% | 1.4% |
| Standard Deviation (Population) | 3.6% | 1.4% |
Similar Demographics by 7th Grade
Demographics Similar to Vietnamese by 7th Grade
In terms of 7th grade, the demographic groups most similar to Vietnamese are Immigrants from Vietnam (93.9%, a difference of 0.030%), Japanese (94.0%, a difference of 0.050%), Immigrants from Bangladesh (94.0%, a difference of 0.080%), Immigrants (94.0%, a difference of 0.090%), and Immigrants from Cuba (93.8%, a difference of 0.11%).
| Demographics | Rating | Rank | 7th Grade |
| Cape Verdeans | 0.0 /100 | #308 | Tragic 94.1% |
| Ecuadorians | 0.0 /100 | #309 | Tragic 94.0% |
| Immigrants | Caribbean | 0.0 /100 | #310 | Tragic 94.0% |
| Puerto Ricans | 0.0 /100 | #311 | Tragic 94.0% |
| Immigrants | Immigrants | 0.0 /100 | #312 | Tragic 94.0% |
| Immigrants | Bangladesh | 0.0 /100 | #313 | Tragic 94.0% |
| Japanese | 0.0 /100 | #314 | Tragic 94.0% |
| Vietnamese | 0.0 /100 | #315 | Tragic 93.9% |
| Immigrants | Vietnam | 0.0 /100 | #316 | Tragic 93.9% |
| Immigrants | Cuba | 0.0 /100 | #317 | Tragic 93.8% |
| Immigrants | Ecuador | 0.0 /100 | #318 | Tragic 93.7% |
| Immigrants | Cambodia | 0.0 /100 | #319 | Tragic 93.7% |
| Immigrants | Fiji | 0.0 /100 | #320 | Tragic 93.5% |
| Belizeans | 0.0 /100 | #321 | Tragic 93.5% |
| Nicaraguans | 0.0 /100 | #322 | Tragic 93.5% |
Demographics Similar to Dutch West Indians by 7th Grade
In terms of 7th grade, the demographic groups most similar to Dutch West Indians are Hawaiian (95.8%, a difference of 0.0%), Navajo (95.8%, a difference of 0.010%), Immigrants from Sudan (95.8%, a difference of 0.010%), African (95.8%, a difference of 0.020%), and Moroccan (95.8%, a difference of 0.030%).
| Demographics | Rating | Rank | 7th Grade |
| Immigrants | Northern Africa | 21.4 /100 | #202 | Fair 95.8% |
| Comanche | 21.1 /100 | #203 | Fair 95.8% |
| Assyrians/Chaldeans/Syriacs | 20.5 /100 | #204 | Fair 95.8% |
| Moroccans | 18.9 /100 | #205 | Poor 95.8% |
| Africans | 17.6 /100 | #206 | Poor 95.8% |
| Navajo | 17.0 /100 | #207 | Poor 95.8% |
| Immigrants | Sudan | 17.0 /100 | #208 | Poor 95.8% |
| Dutch West Indians | 16.1 /100 | #209 | Poor 95.8% |
| Hawaiians | 16.0 /100 | #210 | Poor 95.8% |
| Portuguese | 13.6 /100 | #211 | Poor 95.8% |
| Immigrants | Lebanon | 13.0 /100 | #212 | Poor 95.8% |
| Immigrants | Morocco | 12.6 /100 | #213 | Poor 95.8% |
| Bahamians | 11.6 /100 | #214 | Poor 95.7% |
| Spanish Americans | 9.3 /100 | #215 | Tragic 95.7% |
| Immigrants | Chile | 9.1 /100 | #216 | Tragic 95.7% |