Chickasaw vs Filipino High School Diploma
COMPARE
Chickasaw
Filipino
High School Diploma
High School Diploma Comparison
Chickasaw
Filipinos
88.4%
HIGH SCHOOL DIPLOMA
10.7/ 100
METRIC RATING
216th/ 347
METRIC RANK
91.6%
HIGH SCHOOL DIPLOMA
99.9/ 100
METRIC RATING
21st/ 347
METRIC RANK
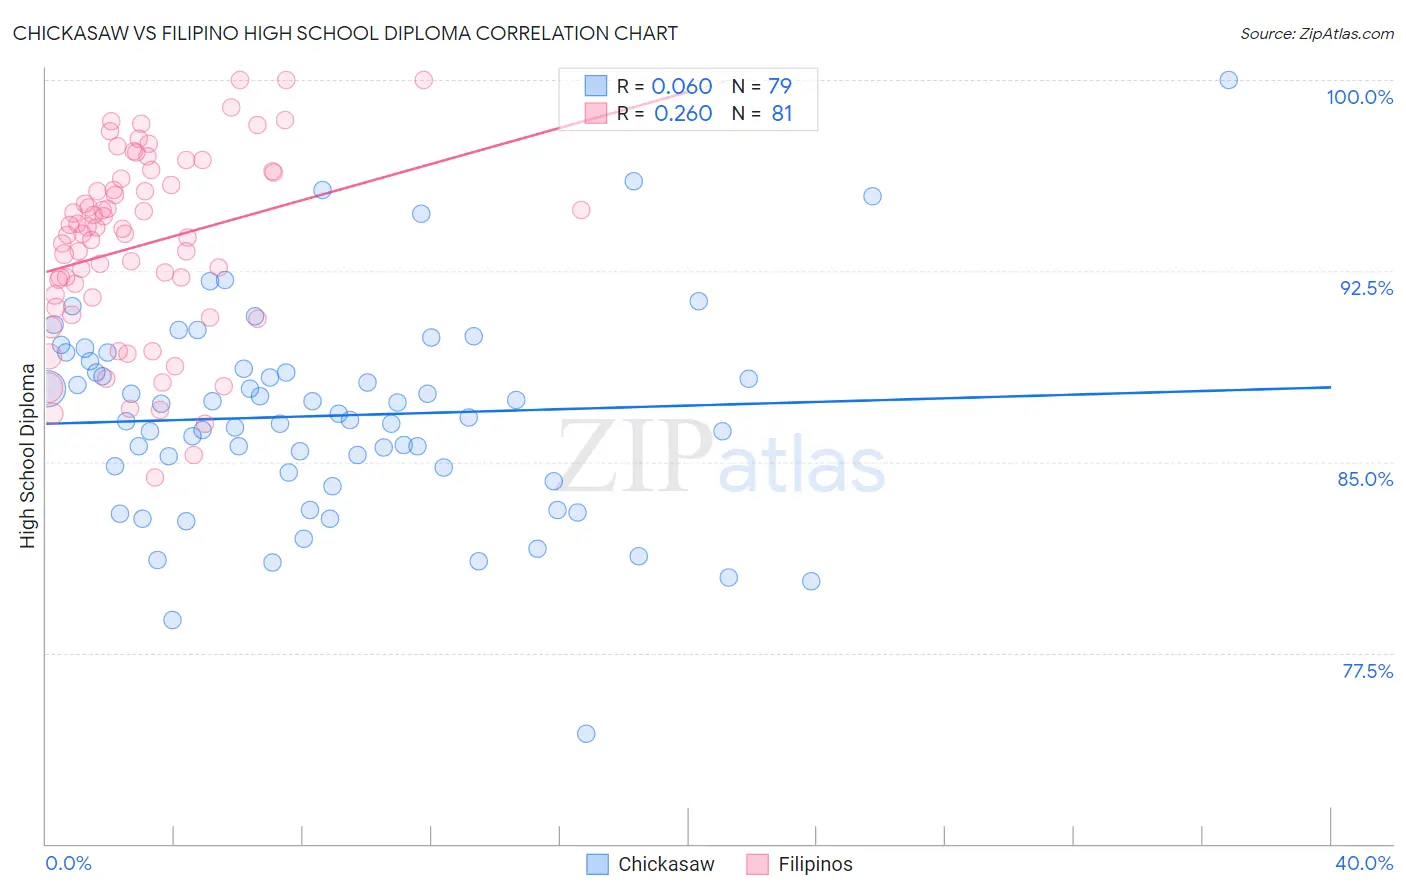
Chickasaw vs Filipino High School Diploma Correlation Chart
The statistical analysis conducted on geographies consisting of 147,726,791 people shows a slight positive correlation between the proportion of Chickasaw and percentage of population with at least high school diploma education in the United States with a correlation coefficient (R) of 0.060 and weighted average of 88.4%. Similarly, the statistical analysis conducted on geographies consisting of 254,351,912 people shows a weak positive correlation between the proportion of Filipinos and percentage of population with at least high school diploma education in the United States with a correlation coefficient (R) of 0.260 and weighted average of 91.6%, a difference of 3.5%.
High School Diploma Correlation Summary
| Measurement | Chickasaw | Filipino |
| Minimum | 74.3% | 84.4% |
| Maximum | 100.0% | 100.0% |
| Range | 25.7% | 15.6% |
| Mean | 86.8% | 93.5% |
| Median | 86.7% | 94.0% |
| Interquartile 25% (IQ1) | 84.6% | 91.2% |
| Interquartile 75% (IQ3) | 89.0% | 96.2% |
| Interquartile Range (IQR) | 4.4% | 5.0% |
| Standard Deviation (Sample) | 4.1% | 3.6% |
| Standard Deviation (Population) | 4.1% | 3.6% |
Similar Demographics by High School Diploma
Demographics Similar to Chickasaw by High School Diploma
In terms of high school diploma, the demographic groups most similar to Chickasaw are Immigrants from Cameroon (88.4%, a difference of 0.010%), Crow (88.4%, a difference of 0.010%), Immigrants from Africa (88.4%, a difference of 0.010%), Immigrants from Somalia (88.4%, a difference of 0.020%), and Immigrants from Bolivia (88.4%, a difference of 0.020%).
| Demographics | Rating | Rank | High School Diploma |
| Cherokee | 14.3 /100 | #209 | Poor 88.5% |
| Samoans | 14.0 /100 | #210 | Poor 88.5% |
| Inupiat | 13.1 /100 | #211 | Poor 88.5% |
| South American Indians | 12.2 /100 | #212 | Poor 88.5% |
| Immigrants | Somalia | 11.3 /100 | #213 | Poor 88.4% |
| Immigrants | Cameroon | 10.9 /100 | #214 | Poor 88.4% |
| Crow | 10.9 /100 | #215 | Poor 88.4% |
| Chickasaw | 10.7 /100 | #216 | Poor 88.4% |
| Immigrants | Africa | 10.6 /100 | #217 | Poor 88.4% |
| Immigrants | Bolivia | 10.3 /100 | #218 | Poor 88.4% |
| Costa Ricans | 9.6 /100 | #219 | Tragic 88.4% |
| Tongans | 9.5 /100 | #220 | Tragic 88.4% |
| Immigrants | Afghanistan | 8.6 /100 | #221 | Tragic 88.3% |
| Colville | 7.8 /100 | #222 | Tragic 88.3% |
| Immigrants | Zaire | 7.6 /100 | #223 | Tragic 88.3% |
Demographics Similar to Filipinos by High School Diploma
In terms of high school diploma, the demographic groups most similar to Filipinos are Czech (91.6%, a difference of 0.010%), Estonian (91.6%, a difference of 0.010%), Maltese (91.6%, a difference of 0.040%), Scandinavian (91.5%, a difference of 0.040%), and Italian (91.5%, a difference of 0.040%).
| Demographics | Rating | Rank | High School Diploma |
| Bulgarians | 100.0 /100 | #14 | Exceptional 91.8% |
| Luxembourgers | 100.0 /100 | #15 | Exceptional 91.7% |
| Finns | 100.0 /100 | #16 | Exceptional 91.7% |
| Immigrants | Singapore | 99.9 /100 | #17 | Exceptional 91.7% |
| Germans | 99.9 /100 | #18 | Exceptional 91.7% |
| Maltese | 99.9 /100 | #19 | Exceptional 91.6% |
| Czechs | 99.9 /100 | #20 | Exceptional 91.6% |
| Filipinos | 99.9 /100 | #21 | Exceptional 91.6% |
| Estonians | 99.9 /100 | #22 | Exceptional 91.6% |
| Scandinavians | 99.9 /100 | #23 | Exceptional 91.5% |
| Italians | 99.9 /100 | #24 | Exceptional 91.5% |
| Thais | 99.9 /100 | #25 | Exceptional 91.5% |
| Russians | 99.9 /100 | #26 | Exceptional 91.5% |
| Cypriots | 99.9 /100 | #27 | Exceptional 91.5% |
| Tlingit-Haida | 99.9 /100 | #28 | Exceptional 91.4% |