U.S. Virgin Islander vs Pakistani No Schooling Completed
COMPARE
U.S. Virgin Islander
Pakistani
No Schooling Completed
No Schooling Completed Comparison
U.S. Virgin Islanders
Pakistanis
2.3%
NO SCHOOLING COMPLETED
3.7/ 100
METRIC RATING
228th/ 347
METRIC RANK
2.1%
NO SCHOOLING COMPLETED
44.7/ 100
METRIC RATING
178th/ 347
METRIC RANK
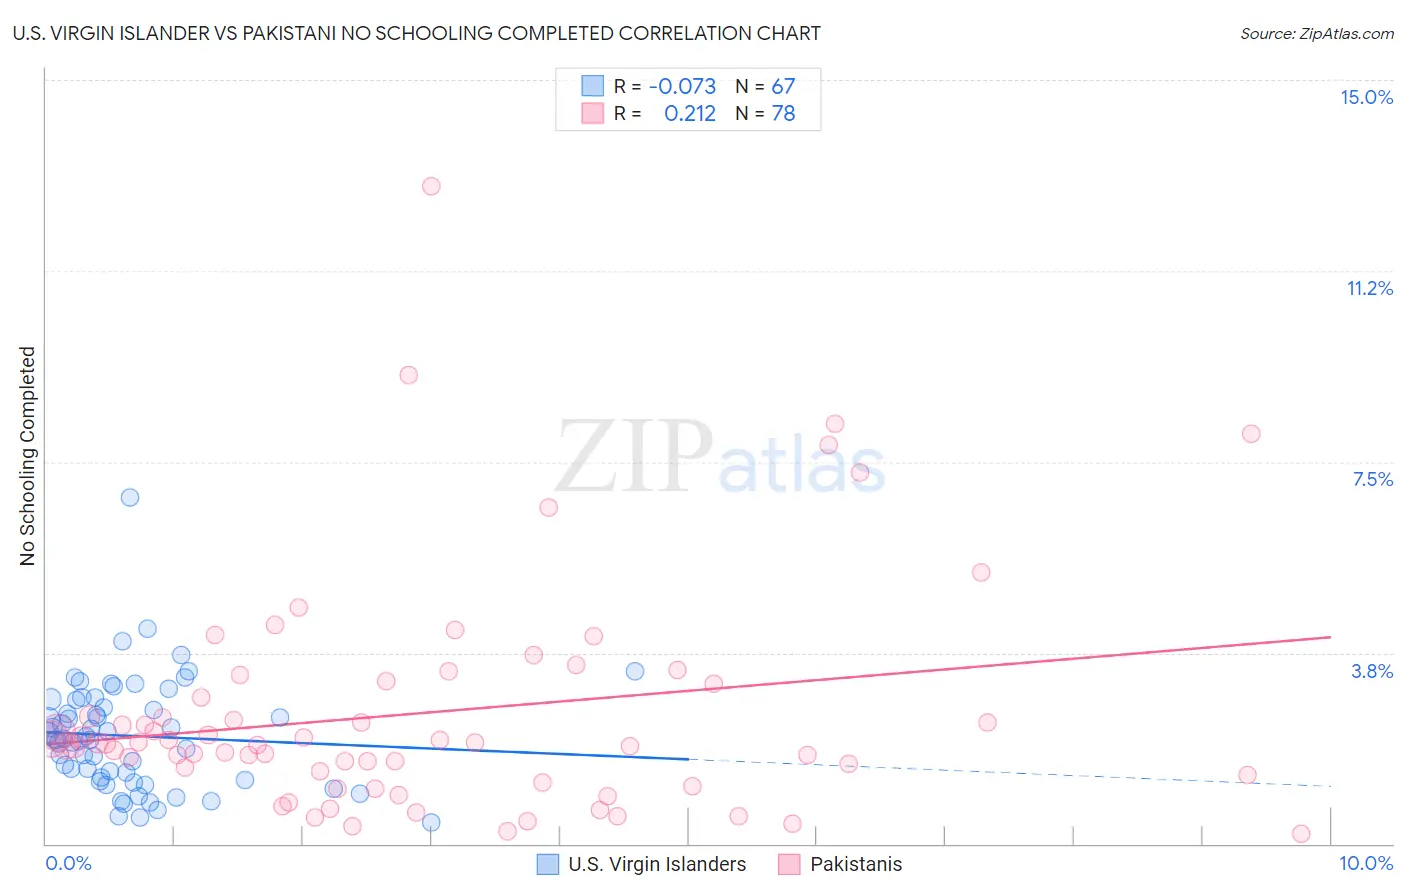
U.S. Virgin Islander vs Pakistani No Schooling Completed Correlation Chart
The statistical analysis conducted on geographies consisting of 87,394,001 people shows a slight negative correlation between the proportion of U.S. Virgin Islanders and percentage of population with no schooling in the United States with a correlation coefficient (R) of -0.073 and weighted average of 2.3%. Similarly, the statistical analysis conducted on geographies consisting of 333,015,834 people shows a weak positive correlation between the proportion of Pakistanis and percentage of population with no schooling in the United States with a correlation coefficient (R) of 0.212 and weighted average of 2.1%, a difference of 10.2%.
No Schooling Completed Correlation Summary
| Measurement | U.S. Virgin Islander | Pakistani |
| Minimum | 0.43% | 0.20% |
| Maximum | 6.8% | 12.9% |
| Range | 6.4% | 12.7% |
| Mean | 2.1% | 2.6% |
| Median | 2.0% | 2.0% |
| Interquartile 25% (IQ1) | 1.2% | 1.3% |
| Interquartile 75% (IQ3) | 2.8% | 3.1% |
| Interquartile Range (IQR) | 1.6% | 1.8% |
| Standard Deviation (Sample) | 1.1% | 2.3% |
| Standard Deviation (Population) | 1.1% | 2.2% |
Similar Demographics by No Schooling Completed
Demographics Similar to U.S. Virgin Islanders by No Schooling Completed
In terms of no schooling completed, the demographic groups most similar to U.S. Virgin Islanders are Immigrants from Pakistan (2.3%, a difference of 0.080%), Puerto Rican (2.3%, a difference of 0.22%), Immigrants from Uruguay (2.3%, a difference of 0.24%), Immigrants from Uganda (2.3%, a difference of 0.29%), and Sierra Leonean (2.3%, a difference of 0.34%).
| Demographics | Rating | Rank | No Schooling Completed |
| Immigrants | Sudan | 5.0 /100 | #221 | Tragic 2.3% |
| Sub-Saharan Africans | 4.7 /100 | #222 | Tragic 2.3% |
| Immigrants | Lebanon | 4.5 /100 | #223 | Tragic 2.3% |
| Tohono O'odham | 4.1 /100 | #224 | Tragic 2.3% |
| Sudanese | 4.1 /100 | #225 | Tragic 2.3% |
| Sierra Leoneans | 4.1 /100 | #226 | Tragic 2.3% |
| Immigrants | Uganda | 4.0 /100 | #227 | Tragic 2.3% |
| U.S. Virgin Islanders | 3.7 /100 | #228 | Tragic 2.3% |
| Immigrants | Pakistan | 3.6 /100 | #229 | Tragic 2.3% |
| Puerto Ricans | 3.4 /100 | #230 | Tragic 2.3% |
| Immigrants | Uruguay | 3.4 /100 | #231 | Tragic 2.3% |
| Colombians | 3.2 /100 | #232 | Tragic 2.3% |
| Immigrants | Malaysia | 2.8 /100 | #233 | Tragic 2.3% |
| Nigerians | 2.6 /100 | #234 | Tragic 2.3% |
| Immigrants | Western Asia | 2.6 /100 | #235 | Tragic 2.3% |
Demographics Similar to Pakistanis by No Schooling Completed
In terms of no schooling completed, the demographic groups most similar to Pakistanis are Arapaho (2.1%, a difference of 0.040%), Immigrants from Kazakhstan (2.1%, a difference of 0.050%), Panamanian (2.1%, a difference of 0.060%), Portuguese (2.1%, a difference of 0.11%), and Arab (2.1%, a difference of 0.23%).
| Demographics | Rating | Rank | No Schooling Completed |
| Immigrants | Poland | 55.2 /100 | #171 | Average 2.1% |
| Immigrants | Argentina | 52.7 /100 | #172 | Average 2.1% |
| Immigrants | Belarus | 51.8 /100 | #173 | Average 2.1% |
| Immigrants | Micronesia | 50.0 /100 | #174 | Average 2.1% |
| Arabs | 46.4 /100 | #175 | Average 2.1% |
| Panamanians | 45.2 /100 | #176 | Average 2.1% |
| Arapaho | 45.0 /100 | #177 | Average 2.1% |
| Pakistanis | 44.7 /100 | #178 | Average 2.1% |
| Immigrants | Kazakhstan | 44.3 /100 | #179 | Average 2.1% |
| Portuguese | 43.9 /100 | #180 | Average 2.1% |
| Immigrants | Taiwan | 42.6 /100 | #181 | Average 2.1% |
| French American Indians | 42.2 /100 | #182 | Average 2.1% |
| Blacks/African Americans | 41.4 /100 | #183 | Average 2.1% |
| Pima | 41.3 /100 | #184 | Average 2.1% |
| Mongolians | 40.8 /100 | #185 | Average 2.1% |