U.S. Virgin Islander vs Pakistani In Labor Force | Age 20-64
COMPARE
U.S. Virgin Islander
Pakistani
In Labor Force | Age 20-64
In Labor Force | Age 20-64 Comparison
U.S. Virgin Islanders
Pakistanis
78.4%
IN LABOR FORCE | AGE 20-64
0.1/ 100
METRIC RATING
267th/ 347
METRIC RANK
79.8%
IN LABOR FORCE | AGE 20-64
79.3/ 100
METRIC RATING
145th/ 347
METRIC RANK
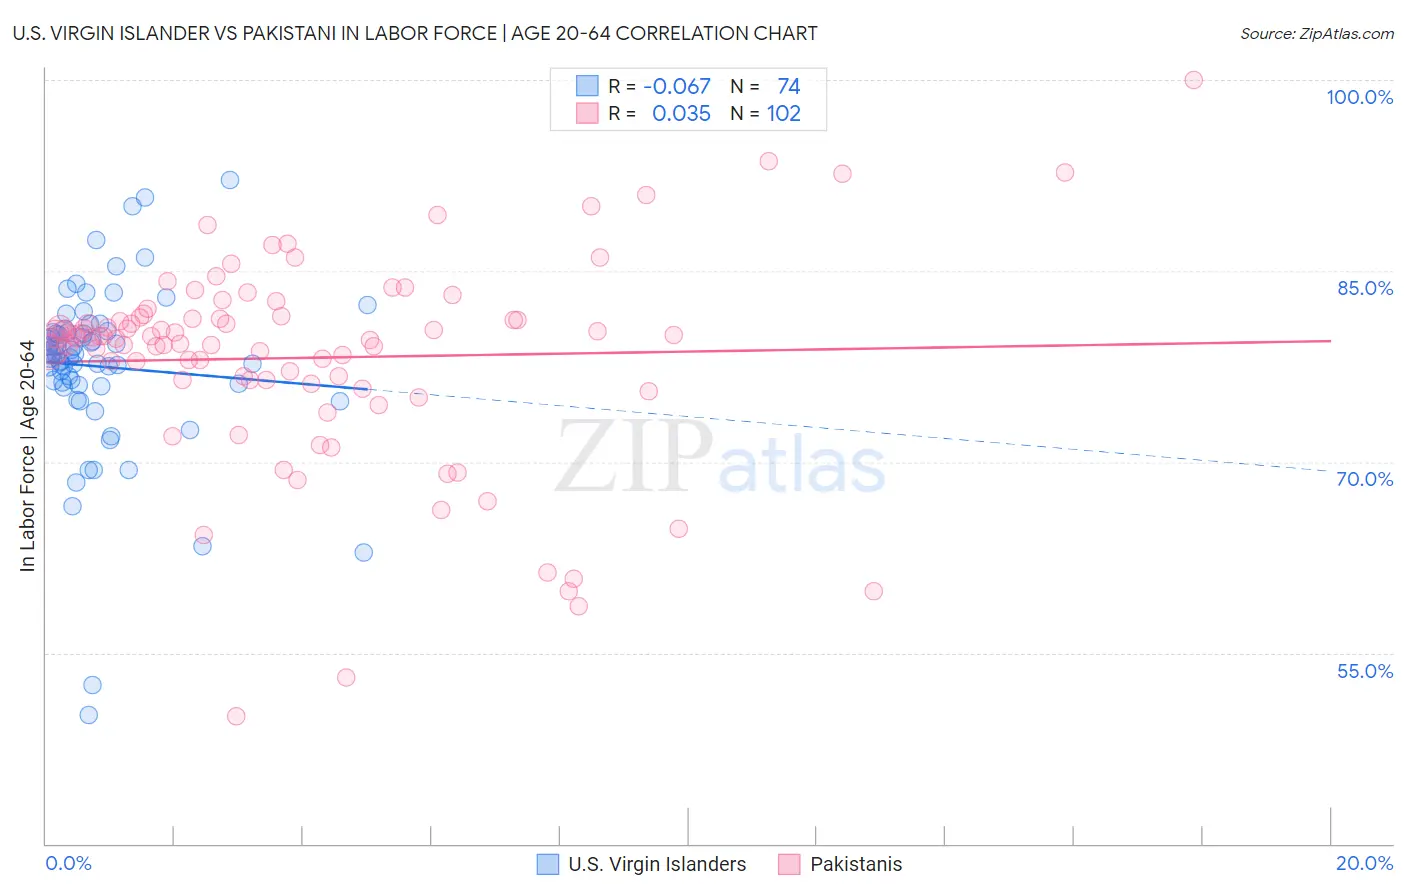
U.S. Virgin Islander vs Pakistani In Labor Force | Age 20-64 Correlation Chart
The statistical analysis conducted on geographies consisting of 87,527,161 people shows a slight negative correlation between the proportion of U.S. Virgin Islanders and labor force participation rate among population between the ages 20 and 64 in the United States with a correlation coefficient (R) of -0.067 and weighted average of 78.4%. Similarly, the statistical analysis conducted on geographies consisting of 335,365,372 people shows no correlation between the proportion of Pakistanis and labor force participation rate among population between the ages 20 and 64 in the United States with a correlation coefficient (R) of 0.035 and weighted average of 79.8%, a difference of 1.8%.
In Labor Force | Age 20-64 Correlation Summary
| Measurement | U.S. Virgin Islander | Pakistani |
| Minimum | 50.1% | 50.0% |
| Maximum | 92.1% | 100.0% |
| Range | 42.0% | 50.0% |
| Mean | 77.5% | 78.2% |
| Median | 78.4% | 79.8% |
| Interquartile 25% (IQ1) | 76.0% | 76.4% |
| Interquartile 75% (IQ3) | 80.2% | 81.4% |
| Interquartile Range (IQR) | 4.2% | 5.0% |
| Standard Deviation (Sample) | 6.9% | 8.2% |
| Standard Deviation (Population) | 6.8% | 8.1% |
Similar Demographics by In Labor Force | Age 20-64
Demographics Similar to U.S. Virgin Islanders by In Labor Force | Age 20-64
In terms of in labor force | age 20-64, the demographic groups most similar to U.S. Virgin Islanders are Bahamian (78.4%, a difference of 0.020%), West Indian (78.3%, a difference of 0.020%), British West Indian (78.4%, a difference of 0.030%), Pennsylvania German (78.4%, a difference of 0.070%), and Spaniard (78.4%, a difference of 0.070%).
| Demographics | Rating | Rank | In Labor Force | Age 20-64 |
| Immigrants | Fiji | 0.3 /100 | #260 | Tragic 78.6% |
| Whites/Caucasians | 0.2 /100 | #261 | Tragic 78.5% |
| Fijians | 0.1 /100 | #262 | Tragic 78.4% |
| Pennsylvania Germans | 0.1 /100 | #263 | Tragic 78.4% |
| Spaniards | 0.1 /100 | #264 | Tragic 78.4% |
| British West Indians | 0.1 /100 | #265 | Tragic 78.4% |
| Bahamians | 0.1 /100 | #266 | Tragic 78.4% |
| U.S. Virgin Islanders | 0.1 /100 | #267 | Tragic 78.4% |
| West Indians | 0.0 /100 | #268 | Tragic 78.3% |
| Immigrants | Barbados | 0.0 /100 | #269 | Tragic 78.3% |
| Scotch-Irish | 0.0 /100 | #270 | Tragic 78.3% |
| Immigrants | Latin America | 0.0 /100 | #271 | Tragic 78.3% |
| Marshallese | 0.0 /100 | #272 | Tragic 78.3% |
| French American Indians | 0.0 /100 | #273 | Tragic 78.2% |
| Aleuts | 0.0 /100 | #274 | Tragic 78.2% |
Demographics Similar to Pakistanis by In Labor Force | Age 20-64
In terms of in labor force | age 20-64, the demographic groups most similar to Pakistanis are Korean (79.8%, a difference of 0.0%), Immigrants from Southern Europe (79.8%, a difference of 0.0%), Immigrants from South Eastern Asia (79.8%, a difference of 0.010%), Immigrants from Israel (79.8%, a difference of 0.010%), and Slovak (79.8%, a difference of 0.010%).
| Demographics | Rating | Rank | In Labor Force | Age 20-64 |
| Immigrants | Nigeria | 86.4 /100 | #138 | Excellent 79.9% |
| Immigrants | Spain | 83.9 /100 | #139 | Excellent 79.8% |
| Immigrants | South Eastern Asia | 80.4 /100 | #140 | Excellent 79.8% |
| Immigrants | Israel | 80.0 /100 | #141 | Good 79.8% |
| Slovaks | 79.9 /100 | #142 | Good 79.8% |
| Immigrants | Sweden | 79.7 /100 | #143 | Good 79.8% |
| Koreans | 79.6 /100 | #144 | Good 79.8% |
| Pakistanis | 79.3 /100 | #145 | Good 79.8% |
| Immigrants | Southern Europe | 78.9 /100 | #146 | Good 79.8% |
| Immigrants | Philippines | 78.0 /100 | #147 | Good 79.8% |
| Romanians | 77.6 /100 | #148 | Good 79.8% |
| Icelanders | 75.1 /100 | #149 | Good 79.7% |
| Costa Ricans | 72.4 /100 | #150 | Good 79.7% |
| Scandinavians | 72.0 /100 | #151 | Good 79.7% |
| Immigrants | Northern Europe | 72.0 /100 | #152 | Good 79.7% |