U.S. Virgin Islander vs Mexican American Indian No Schooling Completed
COMPARE
U.S. Virgin Islander
Mexican American Indian
No Schooling Completed
No Schooling Completed Comparison
U.S. Virgin Islanders
Mexican American Indians
2.3%
NO SCHOOLING COMPLETED
3.7/ 100
METRIC RATING
228th/ 347
METRIC RANK
3.2%
NO SCHOOLING COMPLETED
0.0/ 100
METRIC RATING
324th/ 347
METRIC RANK
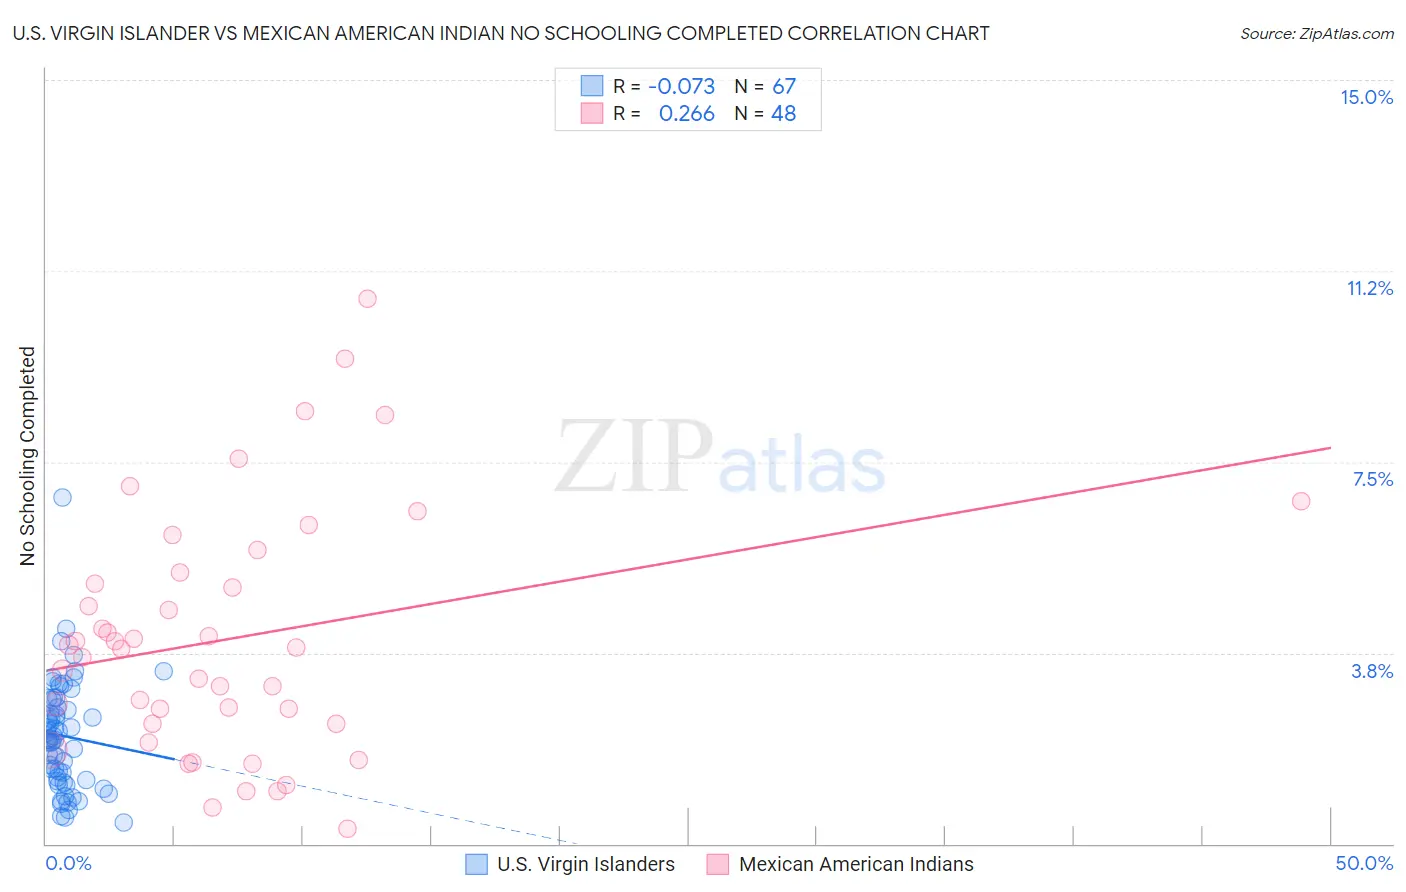
U.S. Virgin Islander vs Mexican American Indian No Schooling Completed Correlation Chart
The statistical analysis conducted on geographies consisting of 87,394,001 people shows a slight negative correlation between the proportion of U.S. Virgin Islanders and percentage of population with no schooling in the United States with a correlation coefficient (R) of -0.073 and weighted average of 2.3%. Similarly, the statistical analysis conducted on geographies consisting of 315,971,799 people shows a weak positive correlation between the proportion of Mexican American Indians and percentage of population with no schooling in the United States with a correlation coefficient (R) of 0.266 and weighted average of 3.2%, a difference of 37.4%.
No Schooling Completed Correlation Summary
| Measurement | U.S. Virgin Islander | Mexican American Indian |
| Minimum | 0.43% | 0.28% |
| Maximum | 6.8% | 10.7% |
| Range | 6.4% | 10.4% |
| Mean | 2.1% | 4.0% |
| Median | 2.0% | 3.8% |
| Interquartile 25% (IQ1) | 1.2% | 2.4% |
| Interquartile 75% (IQ3) | 2.8% | 5.2% |
| Interquartile Range (IQR) | 1.6% | 2.9% |
| Standard Deviation (Sample) | 1.1% | 2.4% |
| Standard Deviation (Population) | 1.1% | 2.4% |
Similar Demographics by No Schooling Completed
Demographics Similar to U.S. Virgin Islanders by No Schooling Completed
In terms of no schooling completed, the demographic groups most similar to U.S. Virgin Islanders are Immigrants from Pakistan (2.3%, a difference of 0.080%), Puerto Rican (2.3%, a difference of 0.22%), Immigrants from Uruguay (2.3%, a difference of 0.24%), Immigrants from Uganda (2.3%, a difference of 0.29%), and Sierra Leonean (2.3%, a difference of 0.34%).
| Demographics | Rating | Rank | No Schooling Completed |
| Immigrants | Sudan | 5.0 /100 | #221 | Tragic 2.3% |
| Sub-Saharan Africans | 4.7 /100 | #222 | Tragic 2.3% |
| Immigrants | Lebanon | 4.5 /100 | #223 | Tragic 2.3% |
| Tohono O'odham | 4.1 /100 | #224 | Tragic 2.3% |
| Sudanese | 4.1 /100 | #225 | Tragic 2.3% |
| Sierra Leoneans | 4.1 /100 | #226 | Tragic 2.3% |
| Immigrants | Uganda | 4.0 /100 | #227 | Tragic 2.3% |
| U.S. Virgin Islanders | 3.7 /100 | #228 | Tragic 2.3% |
| Immigrants | Pakistan | 3.6 /100 | #229 | Tragic 2.3% |
| Puerto Ricans | 3.4 /100 | #230 | Tragic 2.3% |
| Immigrants | Uruguay | 3.4 /100 | #231 | Tragic 2.3% |
| Colombians | 3.2 /100 | #232 | Tragic 2.3% |
| Immigrants | Malaysia | 2.8 /100 | #233 | Tragic 2.3% |
| Nigerians | 2.6 /100 | #234 | Tragic 2.3% |
| Immigrants | Western Asia | 2.6 /100 | #235 | Tragic 2.3% |
Demographics Similar to Mexican American Indians by No Schooling Completed
In terms of no schooling completed, the demographic groups most similar to Mexican American Indians are Vietnamese (3.2%, a difference of 0.34%), Immigrants from Honduras (3.2%, a difference of 0.53%), Dominican (3.2%, a difference of 0.67%), Indonesian (3.2%, a difference of 0.70%), and Immigrants from Laos (3.1%, a difference of 1.2%).
| Demographics | Rating | Rank | No Schooling Completed |
| Cape Verdeans | 0.0 /100 | #317 | Tragic 3.1% |
| Immigrants | Guyana | 0.0 /100 | #318 | Tragic 3.1% |
| Immigrants | Burma/Myanmar | 0.0 /100 | #319 | Tragic 3.1% |
| Immigrants | Bangladesh | 0.0 /100 | #320 | Tragic 3.1% |
| Immigrants | Laos | 0.0 /100 | #321 | Tragic 3.1% |
| Immigrants | Honduras | 0.0 /100 | #322 | Tragic 3.2% |
| Vietnamese | 0.0 /100 | #323 | Tragic 3.2% |
| Mexican American Indians | 0.0 /100 | #324 | Tragic 3.2% |
| Dominicans | 0.0 /100 | #325 | Tragic 3.2% |
| Indonesians | 0.0 /100 | #326 | Tragic 3.2% |
| Immigrants | Latin America | 0.0 /100 | #327 | Tragic 3.3% |
| Mexicans | 0.0 /100 | #328 | Tragic 3.3% |
| Immigrants | Vietnam | 0.0 /100 | #329 | Tragic 3.3% |
| Immigrants | Armenia | 0.0 /100 | #330 | Tragic 3.3% |
| Japanese | 0.0 /100 | #331 | Tragic 3.3% |