Uruguayan vs Immigrants from Nigeria 9th Grade
COMPARE
Uruguayan
Immigrants from Nigeria
9th Grade
9th Grade Comparison
Uruguayans
Immigrants from Nigeria
94.1%
9TH GRADE
1.3/ 100
METRIC RATING
249th/ 347
METRIC RANK
94.0%
9TH GRADE
0.6/ 100
METRIC RATING
255th/ 347
METRIC RANK
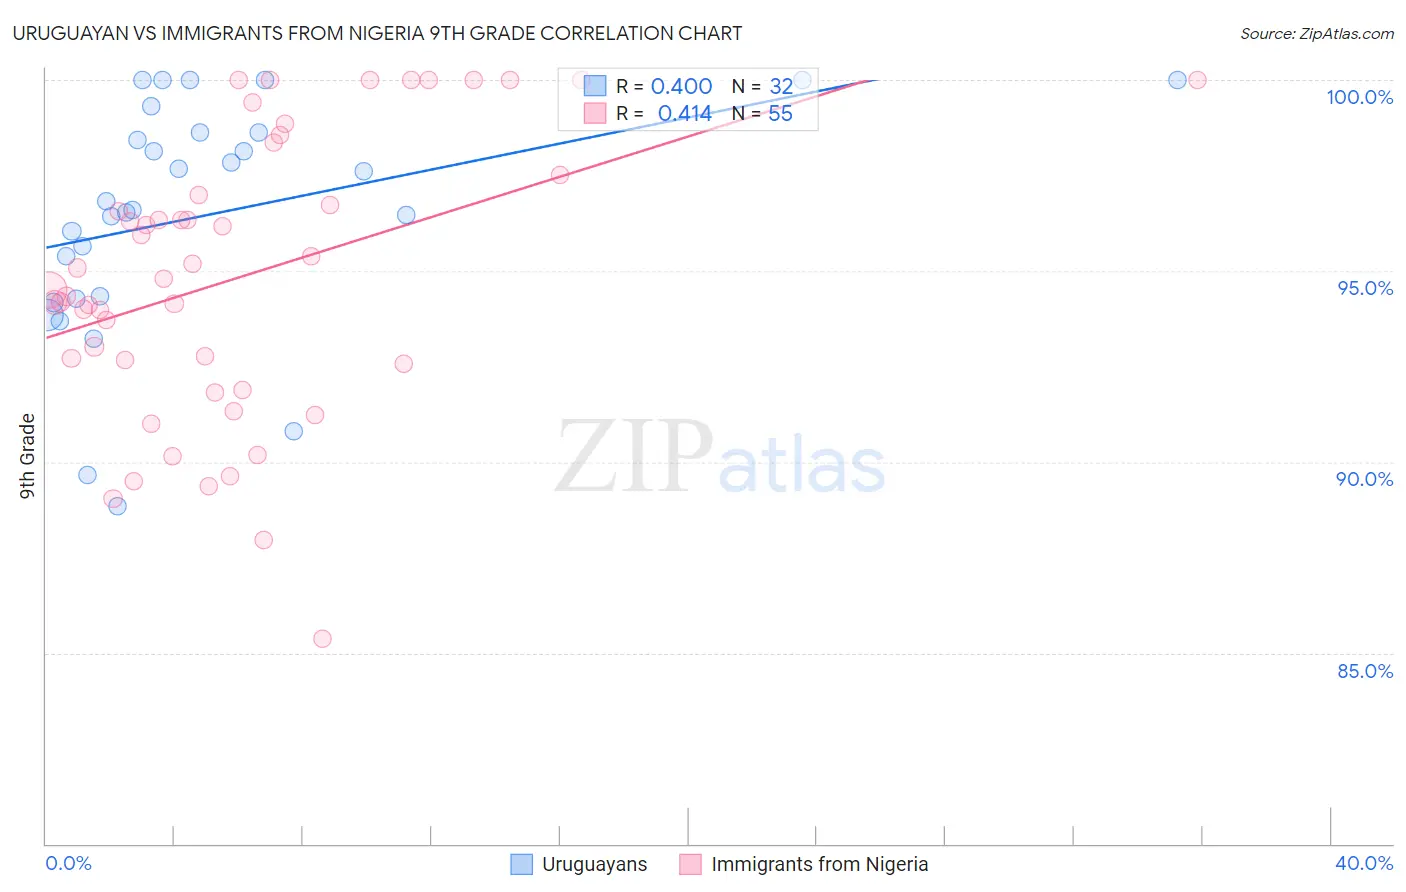
Uruguayan vs Immigrants from Nigeria 9th Grade Correlation Chart
The statistical analysis conducted on geographies consisting of 144,782,794 people shows a mild positive correlation between the proportion of Uruguayans and percentage of population with at least 9th grade education in the United States with a correlation coefficient (R) of 0.400 and weighted average of 94.1%. Similarly, the statistical analysis conducted on geographies consisting of 283,441,873 people shows a moderate positive correlation between the proportion of Immigrants from Nigeria and percentage of population with at least 9th grade education in the United States with a correlation coefficient (R) of 0.414 and weighted average of 94.0%, a difference of 0.16%.
9th Grade Correlation Summary
| Measurement | Uruguayan | Immigrants from Nigeria |
| Minimum | 88.8% | 85.4% |
| Maximum | 100.0% | 100.0% |
| Range | 11.2% | 14.6% |
| Mean | 96.5% | 94.8% |
| Median | 96.7% | 94.8% |
| Interquartile 25% (IQ1) | 94.3% | 92.6% |
| Interquartile 75% (IQ3) | 98.6% | 97.5% |
| Interquartile Range (IQR) | 4.3% | 5.0% |
| Standard Deviation (Sample) | 3.0% | 3.7% |
| Standard Deviation (Population) | 3.0% | 3.6% |
Demographics Similar to Uruguayans and Immigrants from Nigeria by 9th Grade
In terms of 9th grade, the demographic groups most similar to Uruguayans are Immigrants from Hong Kong (94.1%, a difference of 0.0%), Immigrants from Somalia (94.1%, a difference of 0.010%), Afghan (94.2%, a difference of 0.060%), Jamaican (94.1%, a difference of 0.060%), and Paiute (94.2%, a difference of 0.070%). Similarly, the demographic groups most similar to Immigrants from Nigeria are Immigrants from Afghanistan (94.0%, a difference of 0.010%), Immigrants from Costa Rica (94.0%, a difference of 0.030%), Immigrants from Thailand (93.9%, a difference of 0.030%), Ghanaian (93.9%, a difference of 0.030%), and U.S. Virgin Islander (94.0%, a difference of 0.050%).
| Demographics | Rating | Rank | 9th Grade |
| Immigrants | Middle Africa | 2.2 /100 | #242 | Tragic 94.2% |
| Immigrants | Cameroon | 2.1 /100 | #243 | Tragic 94.2% |
| Dutch West Indians | 2.0 /100 | #244 | Tragic 94.2% |
| Paiute | 1.9 /100 | #245 | Tragic 94.2% |
| Senegalese | 1.9 /100 | #246 | Tragic 94.2% |
| Afghans | 1.8 /100 | #247 | Tragic 94.2% |
| Immigrants | Somalia | 1.4 /100 | #248 | Tragic 94.1% |
| Uruguayans | 1.3 /100 | #249 | Tragic 94.1% |
| Immigrants | Hong Kong | 1.3 /100 | #250 | Tragic 94.1% |
| Jamaicans | 1.0 /100 | #251 | Tragic 94.1% |
| Immigrants | Senegal | 0.9 /100 | #252 | Tragic 94.1% |
| Colombians | 0.8 /100 | #253 | Tragic 94.0% |
| U.S. Virgin Islanders | 0.7 /100 | #254 | Tragic 94.0% |
| Immigrants | Nigeria | 0.6 /100 | #255 | Tragic 94.0% |
| Immigrants | Afghanistan | 0.5 /100 | #256 | Tragic 94.0% |
| Immigrants | Costa Rica | 0.5 /100 | #257 | Tragic 94.0% |
| Immigrants | Thailand | 0.5 /100 | #258 | Tragic 93.9% |
| Ghanaians | 0.5 /100 | #259 | Tragic 93.9% |
| Pima | 0.4 /100 | #260 | Tragic 93.9% |
| South Americans | 0.4 /100 | #261 | Tragic 93.9% |
| Immigrants | Jamaica | 0.4 /100 | #262 | Tragic 93.9% |