Immigrants from Netherlands vs Brazilian 8th Grade
COMPARE
Immigrants from Netherlands
Brazilian
8th Grade
8th Grade Comparison
Immigrants from Netherlands
Brazilians
96.5%
8TH GRADE
99.4/ 100
METRIC RATING
76th/ 347
METRIC RANK
95.6%
8TH GRADE
34.8/ 100
METRIC RATING
186th/ 347
METRIC RANK
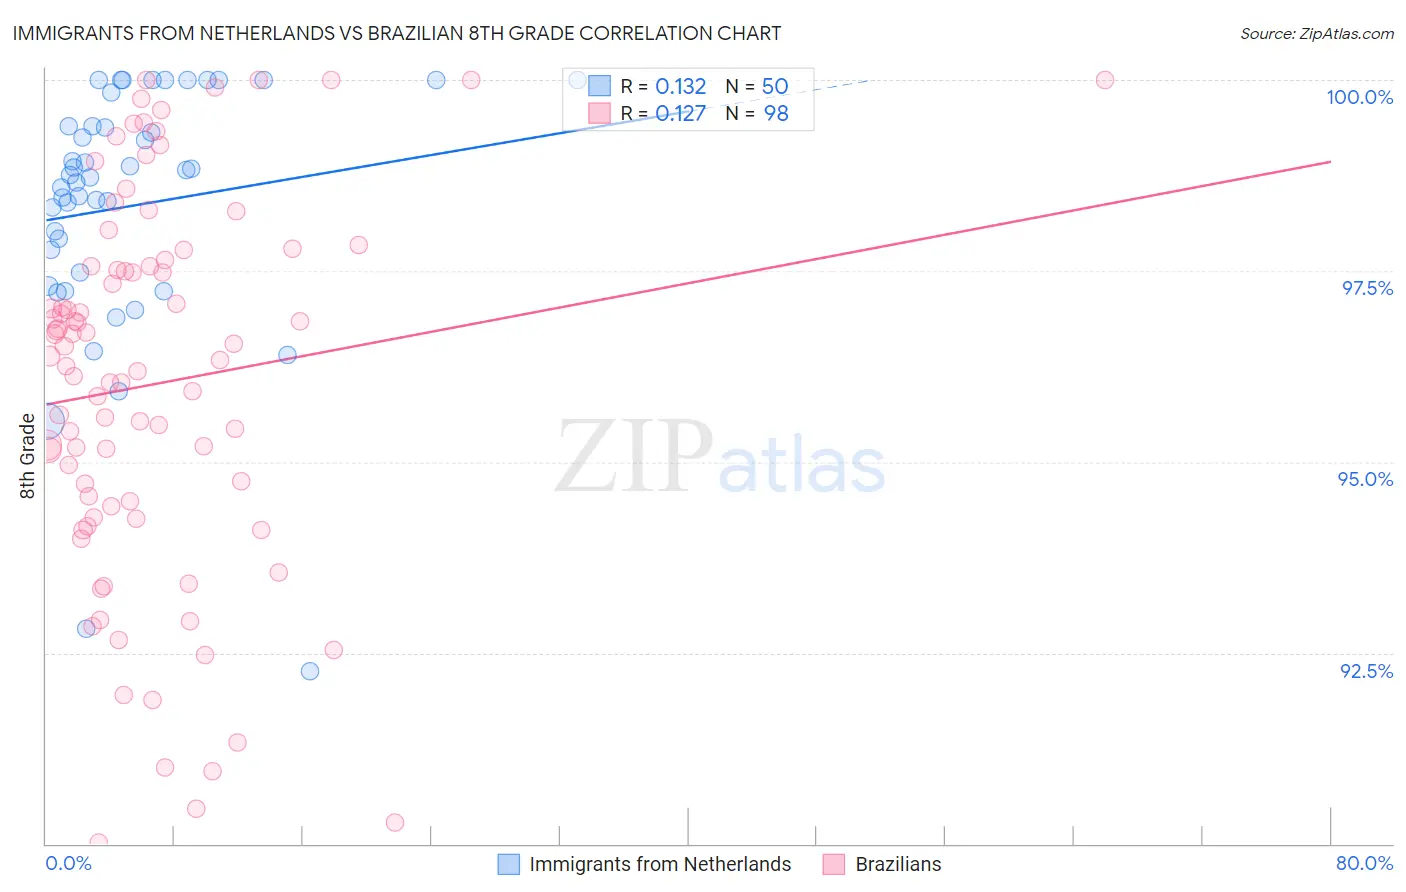
Immigrants from Netherlands vs Brazilian 8th Grade Correlation Chart
The statistical analysis conducted on geographies consisting of 237,869,934 people shows a poor positive correlation between the proportion of Immigrants from Netherlands and percentage of population with at least 8th grade education in the United States with a correlation coefficient (R) of 0.132 and weighted average of 96.5%. Similarly, the statistical analysis conducted on geographies consisting of 323,961,610 people shows a poor positive correlation between the proportion of Brazilians and percentage of population with at least 8th grade education in the United States with a correlation coefficient (R) of 0.127 and weighted average of 95.6%, a difference of 0.94%.
8th Grade Correlation Summary
| Measurement | Immigrants from Netherlands | Brazilian |
| Minimum | 92.3% | 90.0% |
| Maximum | 100.0% | 100.0% |
| Range | 7.7% | 10.0% |
| Mean | 98.4% | 96.0% |
| Median | 98.7% | 96.4% |
| Interquartile 25% (IQ1) | 97.5% | 94.4% |
| Interquartile 75% (IQ3) | 99.4% | 97.6% |
| Interquartile Range (IQR) | 1.9% | 3.1% |
| Standard Deviation (Sample) | 1.7% | 2.5% |
| Standard Deviation (Population) | 1.7% | 2.5% |
Similar Demographics by 8th Grade
Demographics Similar to Immigrants from Netherlands by 8th Grade
In terms of 8th grade, the demographic groups most similar to Immigrants from Netherlands are Zimbabwean (96.5%, a difference of 0.0%), Cypriot (96.5%, a difference of 0.0%), Immigrants from Ireland (96.5%, a difference of 0.010%), Yugoslavian (96.5%, a difference of 0.010%), and New Zealander (96.6%, a difference of 0.020%).
| Demographics | Rating | Rank | 8th Grade |
| Americans | 99.7 /100 | #69 | Exceptional 96.6% |
| Immigrants | Lithuania | 99.6 /100 | #70 | Exceptional 96.6% |
| New Zealanders | 99.5 /100 | #71 | Exceptional 96.6% |
| Immigrants | England | 99.5 /100 | #72 | Exceptional 96.6% |
| Arapaho | 99.5 /100 | #73 | Exceptional 96.6% |
| Immigrants | Ireland | 99.5 /100 | #74 | Exceptional 96.5% |
| Zimbabweans | 99.4 /100 | #75 | Exceptional 96.5% |
| Immigrants | Netherlands | 99.4 /100 | #76 | Exceptional 96.5% |
| Cypriots | 99.4 /100 | #77 | Exceptional 96.5% |
| Yugoslavians | 99.4 /100 | #78 | Exceptional 96.5% |
| Puget Sound Salish | 99.3 /100 | #79 | Exceptional 96.5% |
| Delaware | 99.2 /100 | #80 | Exceptional 96.5% |
| Romanians | 99.2 /100 | #81 | Exceptional 96.5% |
| Turks | 99.2 /100 | #82 | Exceptional 96.5% |
| Icelanders | 99.2 /100 | #83 | Exceptional 96.5% |
Demographics Similar to Brazilians by 8th Grade
In terms of 8th grade, the demographic groups most similar to Brazilians are Black/African American (95.6%, a difference of 0.0%), Immigrants from Iraq (95.6%, a difference of 0.010%), Immigrants from Uganda (95.6%, a difference of 0.010%), Sudanese (95.6%, a difference of 0.010%), and Immigrants from Egypt (95.7%, a difference of 0.020%).
| Demographics | Rating | Rank | 8th Grade |
| Immigrants | Brazil | 45.4 /100 | #179 | Average 95.7% |
| Iraqis | 40.5 /100 | #180 | Average 95.7% |
| Immigrants | Spain | 38.7 /100 | #181 | Fair 95.7% |
| Immigrants | Egypt | 37.9 /100 | #182 | Fair 95.7% |
| Immigrants | Iraq | 36.2 /100 | #183 | Fair 95.6% |
| Immigrants | Uganda | 36.0 /100 | #184 | Fair 95.6% |
| Blacks/African Americans | 34.8 /100 | #185 | Fair 95.6% |
| Brazilians | 34.8 /100 | #186 | Fair 95.6% |
| Sudanese | 33.0 /100 | #187 | Fair 95.6% |
| Liberians | 32.4 /100 | #188 | Fair 95.6% |
| Immigrants | Micronesia | 31.6 /100 | #189 | Fair 95.6% |
| Immigrants | Venezuela | 30.8 /100 | #190 | Fair 95.6% |
| Immigrants | Nepal | 30.2 /100 | #191 | Fair 95.6% |
| Pima | 28.6 /100 | #192 | Fair 95.6% |
| Panamanians | 28.4 /100 | #193 | Fair 95.6% |