Ukrainian vs Immigrants from Bahamas Master's Degree
COMPARE
Ukrainian
Immigrants from Bahamas
Master's Degree
Master's Degree Comparison
Ukrainians
Immigrants from Bahamas
16.9%
MASTER'S DEGREE
98.3/ 100
METRIC RATING
104th/ 347
METRIC RANK
12.9%
MASTER'S DEGREE
1.4/ 100
METRIC RATING
245th/ 347
METRIC RANK
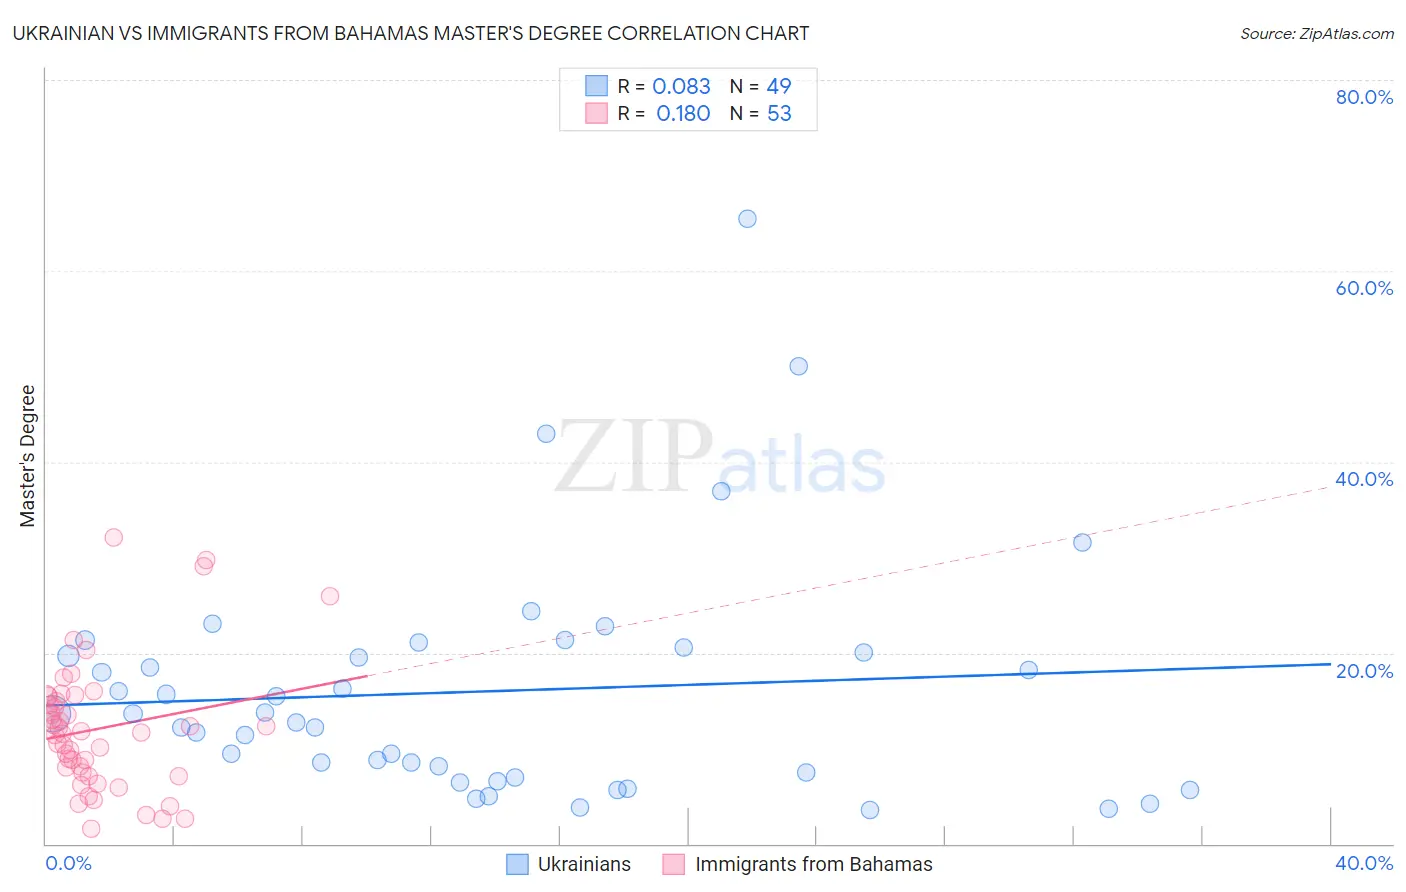
Ukrainian vs Immigrants from Bahamas Master's Degree Correlation Chart
The statistical analysis conducted on geographies consisting of 448,518,691 people shows a slight positive correlation between the proportion of Ukrainians and percentage of population with at least master's degree education in the United States with a correlation coefficient (R) of 0.083 and weighted average of 16.9%. Similarly, the statistical analysis conducted on geographies consisting of 104,646,319 people shows a poor positive correlation between the proportion of Immigrants from Bahamas and percentage of population with at least master's degree education in the United States with a correlation coefficient (R) of 0.180 and weighted average of 12.9%, a difference of 30.7%.
Master's Degree Correlation Summary
| Measurement | Ukrainian | Immigrants from Bahamas |
| Minimum | 3.6% | 1.6% |
| Maximum | 65.5% | 32.1% |
| Range | 61.9% | 30.6% |
| Mean | 16.0% | 12.0% |
| Median | 13.6% | 11.7% |
| Interquartile 25% (IQ1) | 7.2% | 7.3% |
| Interquartile 75% (IQ3) | 20.3% | 15.1% |
| Interquartile Range (IQR) | 13.1% | 7.9% |
| Standard Deviation (Sample) | 12.3% | 6.7% |
| Standard Deviation (Population) | 12.2% | 6.7% |
Similar Demographics by Master's Degree
Demographics Similar to Ukrainians by Master's Degree
In terms of master's degree, the demographic groups most similar to Ukrainians are Syrian (16.8%, a difference of 0.10%), Alsatian (16.9%, a difference of 0.12%), Immigrants from Albania (16.8%, a difference of 0.38%), Chilean (16.9%, a difference of 0.45%), and Armenian (16.8%, a difference of 0.47%).
| Demographics | Rating | Rank | Master's Degree |
| Immigrants | England | 98.8 /100 | #97 | Exceptional 17.0% |
| Immigrants | Ukraine | 98.8 /100 | #98 | Exceptional 17.0% |
| Laotians | 98.8 /100 | #99 | Exceptional 17.0% |
| Albanians | 98.7 /100 | #100 | Exceptional 17.0% |
| Immigrants | Nepal | 98.6 /100 | #101 | Exceptional 17.0% |
| Chileans | 98.6 /100 | #102 | Exceptional 16.9% |
| Alsatians | 98.4 /100 | #103 | Exceptional 16.9% |
| Ukrainians | 98.3 /100 | #104 | Exceptional 16.9% |
| Syrians | 98.3 /100 | #105 | Exceptional 16.8% |
| Immigrants | Albania | 98.1 /100 | #106 | Exceptional 16.8% |
| Armenians | 98.0 /100 | #107 | Exceptional 16.8% |
| Sierra Leoneans | 98.0 /100 | #108 | Exceptional 16.8% |
| Moroccans | 98.0 /100 | #109 | Exceptional 16.8% |
| Immigrants | Chile | 98.0 /100 | #110 | Exceptional 16.8% |
| Austrians | 97.8 /100 | #111 | Exceptional 16.7% |
Demographics Similar to Immigrants from Bahamas by Master's Degree
In terms of master's degree, the demographic groups most similar to Immigrants from Bahamas are Immigrants from Cambodia (12.9%, a difference of 0.040%), Iroquois (12.9%, a difference of 0.070%), African (12.9%, a difference of 0.16%), Cree (12.8%, a difference of 0.47%), and Liberian (12.8%, a difference of 0.47%).
| Demographics | Rating | Rank | Master's Degree |
| Hmong | 4.0 /100 | #238 | Tragic 13.4% |
| Immigrants | Nonimmigrants | 3.4 /100 | #239 | Tragic 13.3% |
| Guamanians/Chamorros | 2.2 /100 | #240 | Tragic 13.1% |
| U.S. Virgin Islanders | 2.1 /100 | #241 | Tragic 13.1% |
| Spanish Americans | 1.9 /100 | #242 | Tragic 13.0% |
| Immigrants | Jamaica | 1.9 /100 | #243 | Tragic 13.0% |
| Delaware | 1.7 /100 | #244 | Tragic 13.0% |
| Immigrants | Bahamas | 1.4 /100 | #245 | Tragic 12.9% |
| Immigrants | Cambodia | 1.4 /100 | #246 | Tragic 12.9% |
| Iroquois | 1.4 /100 | #247 | Tragic 12.9% |
| Africans | 1.4 /100 | #248 | Tragic 12.9% |
| Cree | 1.3 /100 | #249 | Tragic 12.8% |
| Liberians | 1.3 /100 | #250 | Tragic 12.8% |
| Tlingit-Haida | 1.3 /100 | #251 | Tragic 12.8% |
| French American Indians | 1.0 /100 | #252 | Tragic 12.7% |