Ugandan vs Immigrants from Bulgaria 7th Grade
COMPARE
Ugandan
Immigrants from Bulgaria
7th Grade
7th Grade Comparison
Ugandans
Immigrants from Bulgaria
96.2%
7TH GRADE
75.5/ 100
METRIC RATING
157th/ 347
METRIC RANK
96.4%
7TH GRADE
94.0/ 100
METRIC RATING
125th/ 347
METRIC RANK
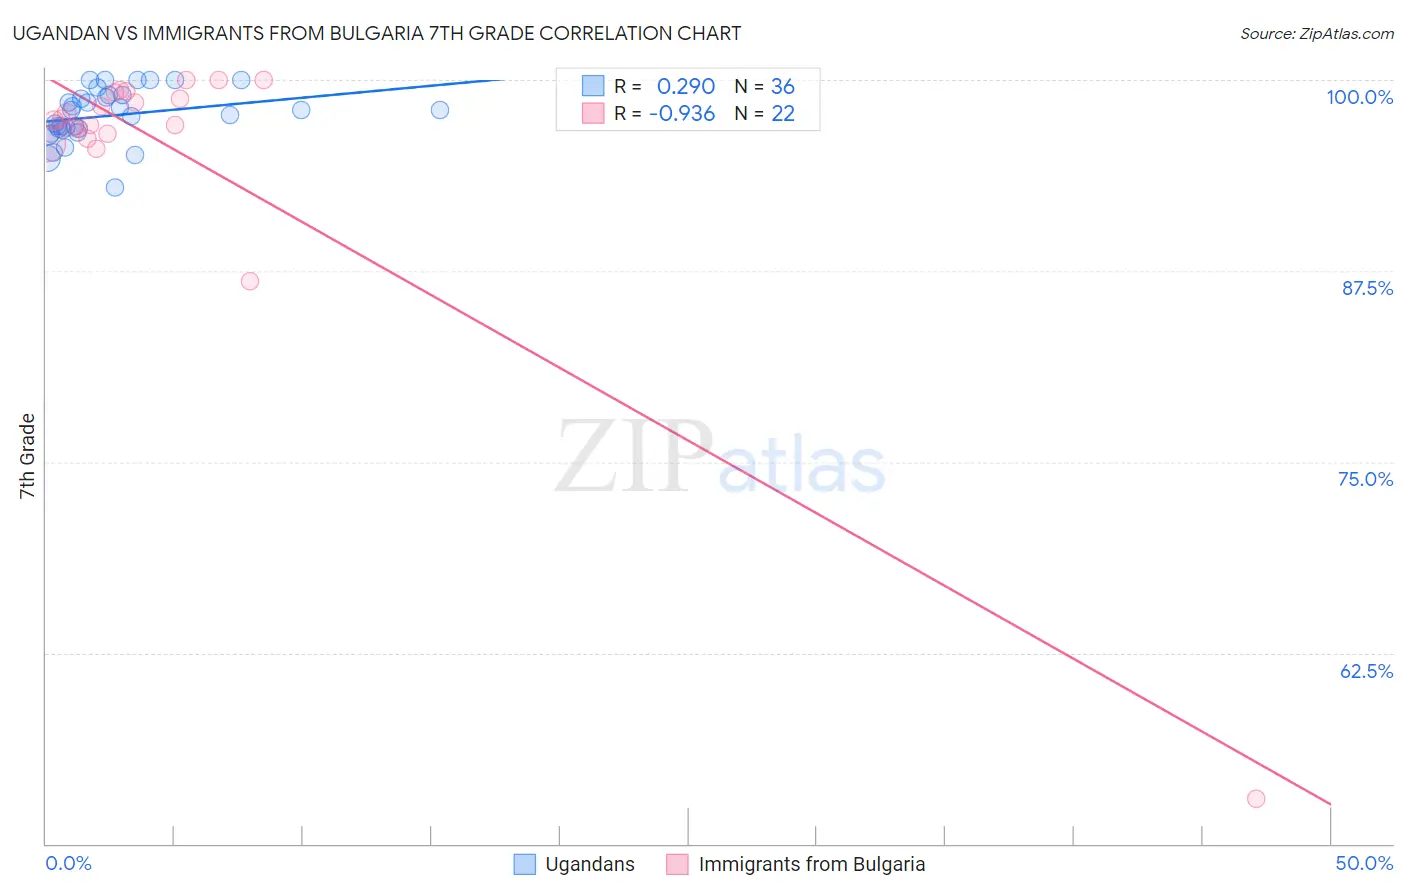
Ugandan vs Immigrants from Bulgaria 7th Grade Correlation Chart
The statistical analysis conducted on geographies consisting of 93,991,892 people shows a weak positive correlation between the proportion of Ugandans and percentage of population with at least 7th grade education in the United States with a correlation coefficient (R) of 0.290 and weighted average of 96.2%. Similarly, the statistical analysis conducted on geographies consisting of 172,552,181 people shows a near-perfect negative correlation between the proportion of Immigrants from Bulgaria and percentage of population with at least 7th grade education in the United States with a correlation coefficient (R) of -0.936 and weighted average of 96.4%, a difference of 0.25%.
7th Grade Correlation Summary
| Measurement | Ugandan | Immigrants from Bulgaria |
| Minimum | 93.0% | 52.9% |
| Maximum | 100.0% | 100.0% |
| Range | 7.0% | 47.1% |
| Mean | 97.7% | 95.4% |
| Median | 97.9% | 97.4% |
| Interquartile 25% (IQ1) | 96.8% | 96.5% |
| Interquartile 75% (IQ3) | 98.9% | 99.2% |
| Interquartile Range (IQR) | 2.1% | 2.7% |
| Standard Deviation (Sample) | 1.7% | 9.9% |
| Standard Deviation (Population) | 1.7% | 9.6% |
Similar Demographics by 7th Grade
Demographics Similar to Ugandans by 7th Grade
In terms of 7th grade, the demographic groups most similar to Ugandans are Immigrants from Jordan (96.2%, a difference of 0.010%), Kenyan (96.2%, a difference of 0.010%), Seminole (96.2%, a difference of 0.020%), Immigrants from Israel (96.2%, a difference of 0.020%), and Immigrants from Russia (96.2%, a difference of 0.030%).
| Demographics | Rating | Rank | 7th Grade |
| Immigrants | Belarus | 82.4 /100 | #150 | Excellent 96.3% |
| Hopi | 81.6 /100 | #151 | Excellent 96.3% |
| Immigrants | Russia | 78.4 /100 | #152 | Good 96.2% |
| Seminole | 78.1 /100 | #153 | Good 96.2% |
| Immigrants | Israel | 77.6 /100 | #154 | Good 96.2% |
| Immigrants | Jordan | 77.0 /100 | #155 | Good 96.2% |
| Kenyans | 76.2 /100 | #156 | Good 96.2% |
| Ugandans | 75.5 /100 | #157 | Good 96.2% |
| Arabs | 68.6 /100 | #158 | Good 96.2% |
| Alsatians | 67.2 /100 | #159 | Good 96.1% |
| Immigrants | Kenya | 66.8 /100 | #160 | Good 96.1% |
| Bermudans | 66.3 /100 | #161 | Good 96.1% |
| Pima | 64.3 /100 | #162 | Good 96.1% |
| Spaniards | 62.6 /100 | #163 | Good 96.1% |
| Immigrants | Italy | 62.1 /100 | #164 | Good 96.1% |
Demographics Similar to Immigrants from Bulgaria by 7th Grade
In terms of 7th grade, the demographic groups most similar to Immigrants from Bulgaria are Immigrants from Switzerland (96.5%, a difference of 0.010%), Palestinian (96.4%, a difference of 0.010%), Immigrants from Europe (96.5%, a difference of 0.020%), Immigrants from France (96.5%, a difference of 0.020%), and Immigrants from Bosnia and Herzegovina (96.4%, a difference of 0.020%).
| Demographics | Rating | Rank | 7th Grade |
| Immigrants | Japan | 95.5 /100 | #118 | Exceptional 96.5% |
| Immigrants | Norway | 95.2 /100 | #119 | Exceptional 96.5% |
| Immigrants | Croatia | 95.0 /100 | #120 | Exceptional 96.5% |
| Cheyenne | 94.9 /100 | #121 | Exceptional 96.5% |
| Immigrants | Europe | 94.8 /100 | #122 | Exceptional 96.5% |
| Immigrants | France | 94.7 /100 | #123 | Exceptional 96.5% |
| Immigrants | Switzerland | 94.5 /100 | #124 | Exceptional 96.5% |
| Immigrants | Bulgaria | 94.0 /100 | #125 | Exceptional 96.4% |
| Palestinians | 93.5 /100 | #126 | Exceptional 96.4% |
| Immigrants | Bosnia and Herzegovina | 93.3 /100 | #127 | Exceptional 96.4% |
| Immigrants | Romania | 93.2 /100 | #128 | Exceptional 96.4% |
| Immigrants | North Macedonia | 93.1 /100 | #129 | Exceptional 96.4% |
| Immigrants | Serbia | 92.8 /100 | #130 | Exceptional 96.4% |
| Filipinos | 92.1 /100 | #131 | Exceptional 96.4% |
| Colville | 91.7 /100 | #132 | Exceptional 96.4% |