Tsimshian vs Immigrants from Bulgaria 7th Grade
COMPARE
Tsimshian
Immigrants from Bulgaria
7th Grade
7th Grade Comparison
Tsimshian
Immigrants from Bulgaria
97.8%
7TH GRADE
100.0/ 100
METRIC RATING
6th/ 347
METRIC RANK
96.4%
7TH GRADE
94.0/ 100
METRIC RATING
125th/ 347
METRIC RANK
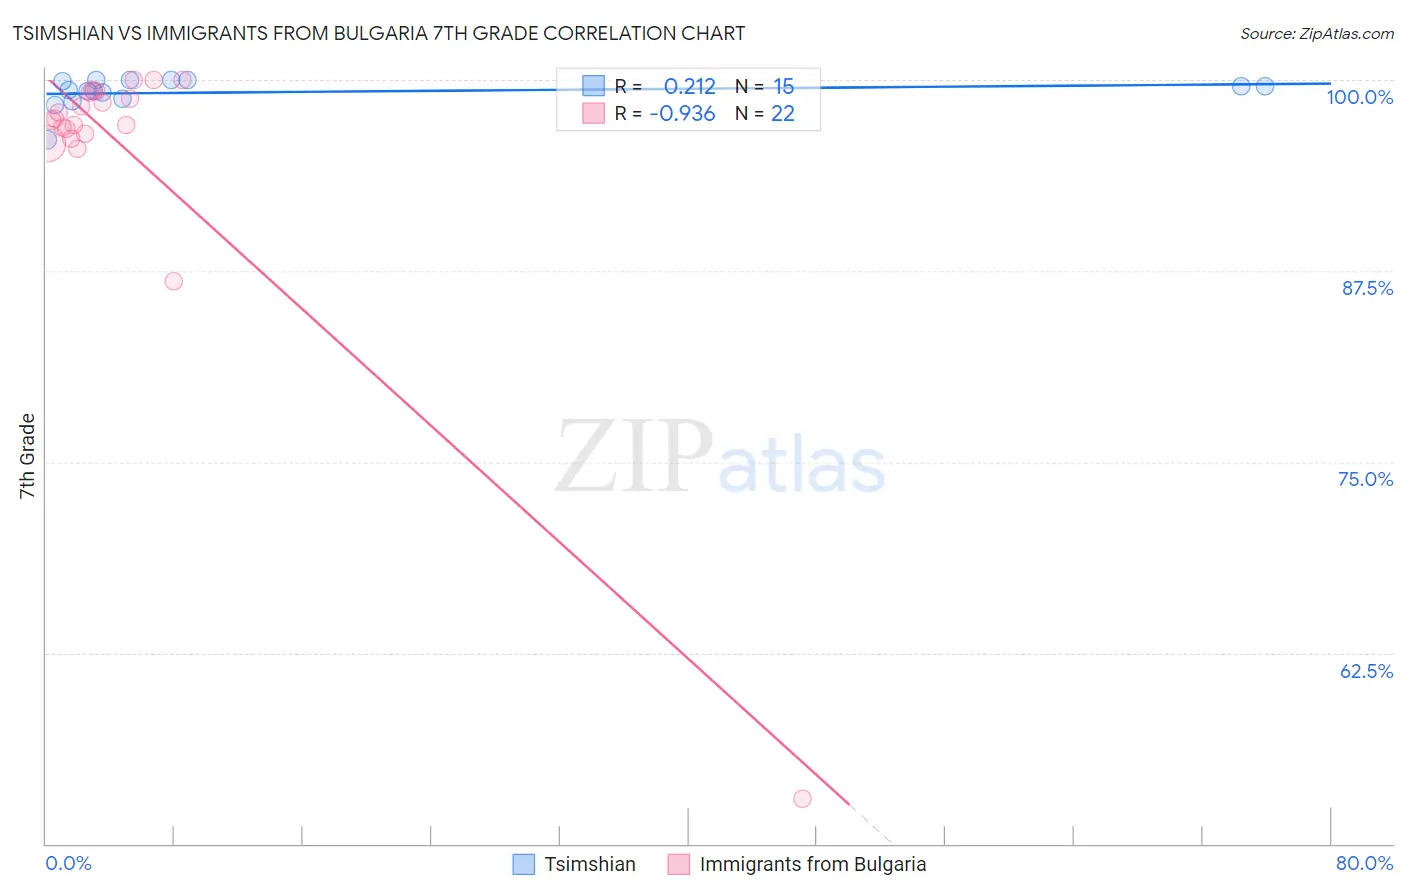
Tsimshian vs Immigrants from Bulgaria 7th Grade Correlation Chart
The statistical analysis conducted on geographies consisting of 15,626,544 people shows a weak positive correlation between the proportion of Tsimshian and percentage of population with at least 7th grade education in the United States with a correlation coefficient (R) of 0.212 and weighted average of 97.8%. Similarly, the statistical analysis conducted on geographies consisting of 172,552,181 people shows a near-perfect negative correlation between the proportion of Immigrants from Bulgaria and percentage of population with at least 7th grade education in the United States with a correlation coefficient (R) of -0.936 and weighted average of 96.4%, a difference of 1.4%.
7th Grade Correlation Summary
| Measurement | Tsimshian | Immigrants from Bulgaria |
| Minimum | 96.1% | 52.9% |
| Maximum | 100.0% | 100.0% |
| Range | 3.9% | 47.1% |
| Mean | 99.2% | 95.4% |
| Median | 99.3% | 97.4% |
| Interquartile 25% (IQ1) | 98.8% | 96.5% |
| Interquartile 75% (IQ3) | 100.0% | 99.2% |
| Interquartile Range (IQR) | 1.2% | 2.7% |
| Standard Deviation (Sample) | 1.0% | 9.9% |
| Standard Deviation (Population) | 0.97% | 9.6% |
Similar Demographics by 7th Grade
Demographics Similar to Tsimshian by 7th Grade
In terms of 7th grade, the demographic groups most similar to Tsimshian are Norwegian (97.8%, a difference of 0.030%), Slovak (97.8%, a difference of 0.040%), Dutch (97.9%, a difference of 0.060%), German (97.7%, a difference of 0.060%), and Slovene (97.6%, a difference of 0.16%).
| Demographics | Rating | Rank | 7th Grade |
| Crow | 100.0 /100 | #1 | Exceptional 99.1% |
| Finns | 100.0 /100 | #2 | Exceptional 98.5% |
| Carpatho Rusyns | 100.0 /100 | #3 | Exceptional 98.3% |
| Ottawa | 100.0 /100 | #4 | Exceptional 98.1% |
| Dutch | 100.0 /100 | #5 | Exceptional 97.9% |
| Tsimshian | 100.0 /100 | #6 | Exceptional 97.8% |
| Norwegians | 100.0 /100 | #7 | Exceptional 97.8% |
| Slovaks | 100.0 /100 | #8 | Exceptional 97.8% |
| Germans | 100.0 /100 | #9 | Exceptional 97.7% |
| Slovenes | 100.0 /100 | #10 | Exceptional 97.6% |
| Alaskan Athabascans | 100.0 /100 | #11 | Exceptional 97.6% |
| Poles | 100.0 /100 | #12 | Exceptional 97.6% |
| Swedes | 100.0 /100 | #13 | Exceptional 97.6% |
| Pennsylvania Germans | 100.0 /100 | #14 | Exceptional 97.6% |
| English | 100.0 /100 | #15 | Exceptional 97.6% |
Demographics Similar to Immigrants from Bulgaria by 7th Grade
In terms of 7th grade, the demographic groups most similar to Immigrants from Bulgaria are Immigrants from Switzerland (96.5%, a difference of 0.010%), Palestinian (96.4%, a difference of 0.010%), Immigrants from Europe (96.5%, a difference of 0.020%), Immigrants from France (96.5%, a difference of 0.020%), and Immigrants from Bosnia and Herzegovina (96.4%, a difference of 0.020%).
| Demographics | Rating | Rank | 7th Grade |
| Immigrants | Japan | 95.5 /100 | #118 | Exceptional 96.5% |
| Immigrants | Norway | 95.2 /100 | #119 | Exceptional 96.5% |
| Immigrants | Croatia | 95.0 /100 | #120 | Exceptional 96.5% |
| Cheyenne | 94.9 /100 | #121 | Exceptional 96.5% |
| Immigrants | Europe | 94.8 /100 | #122 | Exceptional 96.5% |
| Immigrants | France | 94.7 /100 | #123 | Exceptional 96.5% |
| Immigrants | Switzerland | 94.5 /100 | #124 | Exceptional 96.5% |
| Immigrants | Bulgaria | 94.0 /100 | #125 | Exceptional 96.4% |
| Palestinians | 93.5 /100 | #126 | Exceptional 96.4% |
| Immigrants | Bosnia and Herzegovina | 93.3 /100 | #127 | Exceptional 96.4% |
| Immigrants | Romania | 93.2 /100 | #128 | Exceptional 96.4% |
| Immigrants | North Macedonia | 93.1 /100 | #129 | Exceptional 96.4% |
| Immigrants | Serbia | 92.8 /100 | #130 | Exceptional 96.4% |
| Filipinos | 92.1 /100 | #131 | Exceptional 96.4% |
| Colville | 91.7 /100 | #132 | Exceptional 96.4% |