Ugandan vs Central American 7th Grade
COMPARE
Ugandan
Central American
7th Grade
7th Grade Comparison
Ugandans
Central Americans
96.2%
7TH GRADE
75.5/ 100
METRIC RATING
157th/ 347
METRIC RANK
92.1%
7TH GRADE
0.0/ 100
METRIC RATING
338th/ 347
METRIC RANK
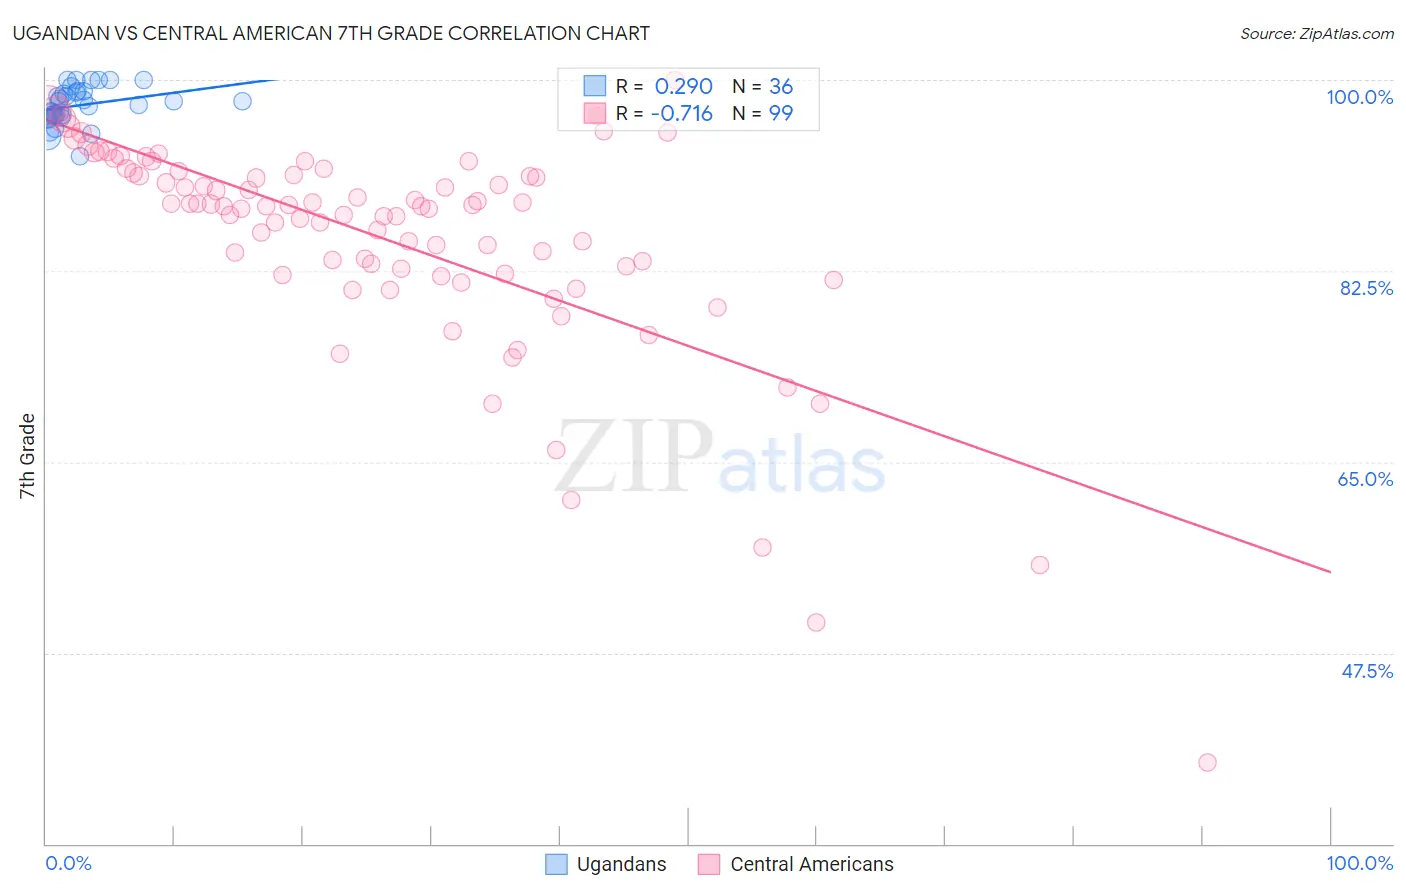
Ugandan vs Central American 7th Grade Correlation Chart
The statistical analysis conducted on geographies consisting of 93,991,892 people shows a weak positive correlation between the proportion of Ugandans and percentage of population with at least 7th grade education in the United States with a correlation coefficient (R) of 0.290 and weighted average of 96.2%. Similarly, the statistical analysis conducted on geographies consisting of 504,619,347 people shows a strong negative correlation between the proportion of Central Americans and percentage of population with at least 7th grade education in the United States with a correlation coefficient (R) of -0.716 and weighted average of 92.1%, a difference of 4.4%.
7th Grade Correlation Summary
| Measurement | Ugandan | Central American |
| Minimum | 93.0% | 37.5% |
| Maximum | 100.0% | 100.0% |
| Range | 7.0% | 62.5% |
| Mean | 97.7% | 85.5% |
| Median | 97.9% | 88.4% |
| Interquartile 25% (IQ1) | 96.8% | 82.2% |
| Interquartile 75% (IQ3) | 98.9% | 91.5% |
| Interquartile Range (IQR) | 2.1% | 9.3% |
| Standard Deviation (Sample) | 1.7% | 10.2% |
| Standard Deviation (Population) | 1.7% | 10.1% |
Similar Demographics by 7th Grade
Demographics Similar to Ugandans by 7th Grade
In terms of 7th grade, the demographic groups most similar to Ugandans are Immigrants from Jordan (96.2%, a difference of 0.010%), Kenyan (96.2%, a difference of 0.010%), Seminole (96.2%, a difference of 0.020%), Immigrants from Israel (96.2%, a difference of 0.020%), and Immigrants from Russia (96.2%, a difference of 0.030%).
| Demographics | Rating | Rank | 7th Grade |
| Immigrants | Belarus | 82.4 /100 | #150 | Excellent 96.3% |
| Hopi | 81.6 /100 | #151 | Excellent 96.3% |
| Immigrants | Russia | 78.4 /100 | #152 | Good 96.2% |
| Seminole | 78.1 /100 | #153 | Good 96.2% |
| Immigrants | Israel | 77.6 /100 | #154 | Good 96.2% |
| Immigrants | Jordan | 77.0 /100 | #155 | Good 96.2% |
| Kenyans | 76.2 /100 | #156 | Good 96.2% |
| Ugandans | 75.5 /100 | #157 | Good 96.2% |
| Arabs | 68.6 /100 | #158 | Good 96.2% |
| Alsatians | 67.2 /100 | #159 | Good 96.1% |
| Immigrants | Kenya | 66.8 /100 | #160 | Good 96.1% |
| Bermudans | 66.3 /100 | #161 | Good 96.1% |
| Pima | 64.3 /100 | #162 | Good 96.1% |
| Spaniards | 62.6 /100 | #163 | Good 96.1% |
| Immigrants | Italy | 62.1 /100 | #164 | Good 96.1% |
Demographics Similar to Central Americans by 7th Grade
In terms of 7th grade, the demographic groups most similar to Central Americans are Immigrants from Latin America (92.2%, a difference of 0.13%), Mexican (91.9%, a difference of 0.25%), Immigrants from Honduras (92.5%, a difference of 0.40%), Yakama (91.7%, a difference of 0.44%), and Guatemalan (91.7%, a difference of 0.46%).
| Demographics | Rating | Rank | 7th Grade |
| Hondurans | 0.0 /100 | #331 | Tragic 92.9% |
| Hispanics or Latinos | 0.0 /100 | #332 | Tragic 92.7% |
| Immigrants | Armenia | 0.0 /100 | #333 | Tragic 92.7% |
| Immigrants | Yemen | 0.0 /100 | #334 | Tragic 92.6% |
| Mexican American Indians | 0.0 /100 | #335 | Tragic 92.6% |
| Immigrants | Honduras | 0.0 /100 | #336 | Tragic 92.5% |
| Immigrants | Latin America | 0.0 /100 | #337 | Tragic 92.2% |
| Central Americans | 0.0 /100 | #338 | Tragic 92.1% |
| Mexicans | 0.0 /100 | #339 | Tragic 91.9% |
| Yakama | 0.0 /100 | #340 | Tragic 91.7% |
| Guatemalans | 0.0 /100 | #341 | Tragic 91.7% |
| Salvadorans | 0.0 /100 | #342 | Tragic 91.5% |
| Immigrants | Guatemala | 0.0 /100 | #343 | Tragic 91.3% |
| Immigrants | Central America | 0.0 /100 | #344 | Tragic 91.0% |
| Immigrants | El Salvador | 0.0 /100 | #345 | Tragic 90.9% |