Ugandan vs Northern European 7th Grade
COMPARE
Ugandan
Northern European
7th Grade
7th Grade Comparison
Ugandans
Northern Europeans
96.2%
7TH GRADE
75.5/ 100
METRIC RATING
157th/ 347
METRIC RANK
97.1%
7TH GRADE
99.9/ 100
METRIC RATING
44th/ 347
METRIC RANK
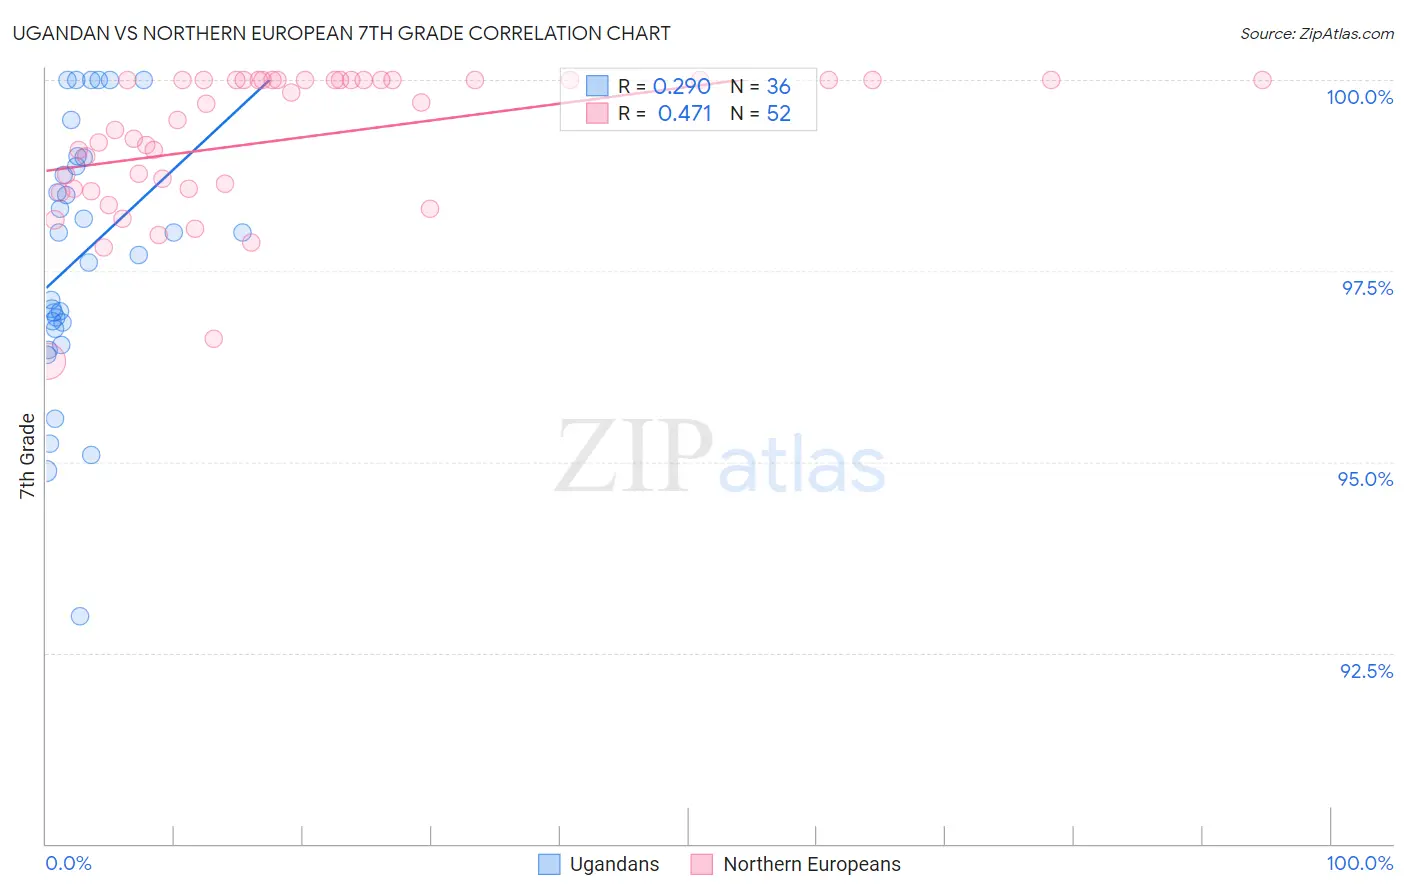
Ugandan vs Northern European 7th Grade Correlation Chart
The statistical analysis conducted on geographies consisting of 93,991,892 people shows a weak positive correlation between the proportion of Ugandans and percentage of population with at least 7th grade education in the United States with a correlation coefficient (R) of 0.290 and weighted average of 96.2%. Similarly, the statistical analysis conducted on geographies consisting of 406,093,361 people shows a moderate positive correlation between the proportion of Northern Europeans and percentage of population with at least 7th grade education in the United States with a correlation coefficient (R) of 0.471 and weighted average of 97.1%, a difference of 0.93%.
7th Grade Correlation Summary
| Measurement | Ugandan | Northern European |
| Minimum | 93.0% | 96.3% |
| Maximum | 100.0% | 100.0% |
| Range | 7.0% | 3.7% |
| Mean | 97.7% | 99.2% |
| Median | 97.9% | 99.6% |
| Interquartile 25% (IQ1) | 96.8% | 98.6% |
| Interquartile 75% (IQ3) | 98.9% | 100.0% |
| Interquartile Range (IQR) | 2.1% | 1.4% |
| Standard Deviation (Sample) | 1.7% | 0.92% |
| Standard Deviation (Population) | 1.7% | 0.91% |
Similar Demographics by 7th Grade
Demographics Similar to Ugandans by 7th Grade
In terms of 7th grade, the demographic groups most similar to Ugandans are Immigrants from Jordan (96.2%, a difference of 0.010%), Kenyan (96.2%, a difference of 0.010%), Seminole (96.2%, a difference of 0.020%), Immigrants from Israel (96.2%, a difference of 0.020%), and Immigrants from Russia (96.2%, a difference of 0.030%).
| Demographics | Rating | Rank | 7th Grade |
| Immigrants | Belarus | 82.4 /100 | #150 | Excellent 96.3% |
| Hopi | 81.6 /100 | #151 | Excellent 96.3% |
| Immigrants | Russia | 78.4 /100 | #152 | Good 96.2% |
| Seminole | 78.1 /100 | #153 | Good 96.2% |
| Immigrants | Israel | 77.6 /100 | #154 | Good 96.2% |
| Immigrants | Jordan | 77.0 /100 | #155 | Good 96.2% |
| Kenyans | 76.2 /100 | #156 | Good 96.2% |
| Ugandans | 75.5 /100 | #157 | Good 96.2% |
| Arabs | 68.6 /100 | #158 | Good 96.2% |
| Alsatians | 67.2 /100 | #159 | Good 96.1% |
| Immigrants | Kenya | 66.8 /100 | #160 | Good 96.1% |
| Bermudans | 66.3 /100 | #161 | Good 96.1% |
| Pima | 64.3 /100 | #162 | Good 96.1% |
| Spaniards | 62.6 /100 | #163 | Good 96.1% |
| Immigrants | Italy | 62.1 /100 | #164 | Good 96.1% |
Demographics Similar to Northern Europeans by 7th Grade
In terms of 7th grade, the demographic groups most similar to Northern Europeans are Maltese (97.1%, a difference of 0.0%), Czechoslovakian (97.1%, a difference of 0.010%), Aleut (97.1%, a difference of 0.010%), Bulgarian (97.1%, a difference of 0.030%), and Chinese (97.1%, a difference of 0.040%).
| Demographics | Rating | Rank | 7th Grade |
| British | 100.0 /100 | #37 | Exceptional 97.2% |
| Belgians | 100.0 /100 | #38 | Exceptional 97.2% |
| Latvians | 100.0 /100 | #39 | Exceptional 97.2% |
| Luxembourgers | 100.0 /100 | #40 | Exceptional 97.2% |
| Eastern Europeans | 100.0 /100 | #41 | Exceptional 97.2% |
| Chinese | 99.9 /100 | #42 | Exceptional 97.1% |
| Maltese | 99.9 /100 | #43 | Exceptional 97.1% |
| Northern Europeans | 99.9 /100 | #44 | Exceptional 97.1% |
| Czechoslovakians | 99.9 /100 | #45 | Exceptional 97.1% |
| Aleuts | 99.9 /100 | #46 | Exceptional 97.1% |
| Bulgarians | 99.9 /100 | #47 | Exceptional 97.1% |
| Celtics | 99.9 /100 | #48 | Exceptional 97.1% |
| Slavs | 99.9 /100 | #49 | Exceptional 97.1% |
| Immigrants | Scotland | 99.9 /100 | #50 | Exceptional 97.1% |
| Estonians | 99.9 /100 | #51 | Exceptional 97.0% |