Navajo vs Central American 7th Grade
COMPARE
Navajo
Central American
7th Grade
7th Grade Comparison
Navajo
Central Americans
95.8%
7TH GRADE
17.0/ 100
METRIC RATING
207th/ 347
METRIC RANK
92.1%
7TH GRADE
0.0/ 100
METRIC RATING
338th/ 347
METRIC RANK
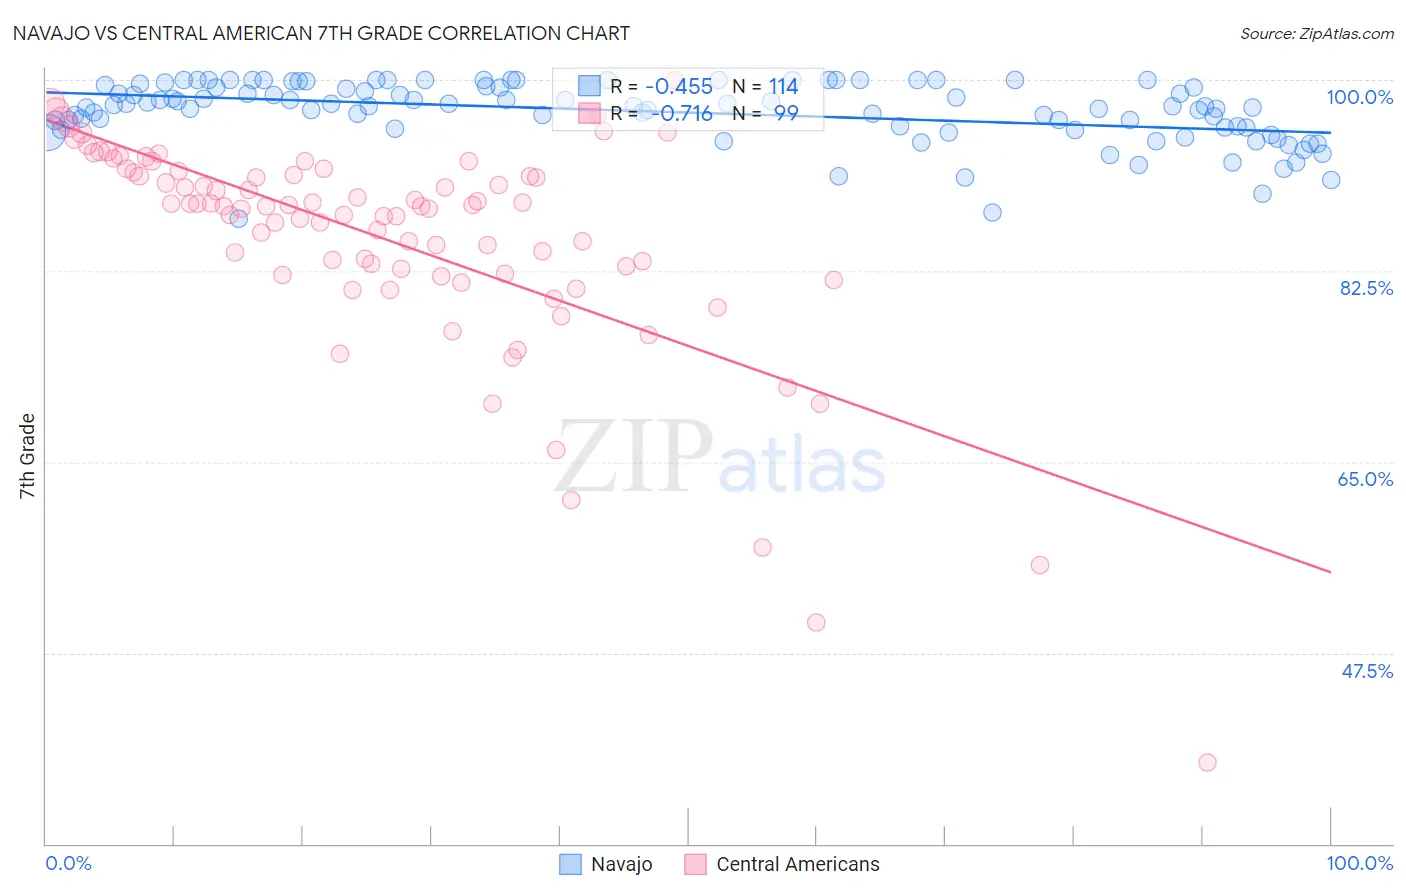
Navajo vs Central American 7th Grade Correlation Chart
The statistical analysis conducted on geographies consisting of 224,871,965 people shows a moderate negative correlation between the proportion of Navajo and percentage of population with at least 7th grade education in the United States with a correlation coefficient (R) of -0.455 and weighted average of 95.8%. Similarly, the statistical analysis conducted on geographies consisting of 504,619,347 people shows a strong negative correlation between the proportion of Central Americans and percentage of population with at least 7th grade education in the United States with a correlation coefficient (R) of -0.716 and weighted average of 92.1%, a difference of 4.0%.
7th Grade Correlation Summary
| Measurement | Navajo | Central American |
| Minimum | 87.2% | 37.5% |
| Maximum | 100.0% | 100.0% |
| Range | 12.8% | 62.5% |
| Mean | 97.1% | 85.5% |
| Median | 97.6% | 88.4% |
| Interquartile 25% (IQ1) | 95.7% | 82.2% |
| Interquartile 75% (IQ3) | 99.4% | 91.5% |
| Interquartile Range (IQR) | 3.7% | 9.3% |
| Standard Deviation (Sample) | 2.8% | 10.2% |
| Standard Deviation (Population) | 2.8% | 10.1% |
Similar Demographics by 7th Grade
Demographics Similar to Navajo by 7th Grade
In terms of 7th grade, the demographic groups most similar to Navajo are Immigrants from Sudan (95.8%, a difference of 0.0%), African (95.8%, a difference of 0.010%), Dutch West Indian (95.8%, a difference of 0.010%), Hawaiian (95.8%, a difference of 0.010%), and Moroccan (95.8%, a difference of 0.020%).
| Demographics | Rating | Rank | 7th Grade |
| Argentineans | 23.2 /100 | #200 | Fair 95.9% |
| Immigrants | Argentina | 21.9 /100 | #201 | Fair 95.9% |
| Immigrants | Northern Africa | 21.4 /100 | #202 | Fair 95.8% |
| Comanche | 21.1 /100 | #203 | Fair 95.8% |
| Assyrians/Chaldeans/Syriacs | 20.5 /100 | #204 | Fair 95.8% |
| Moroccans | 18.9 /100 | #205 | Poor 95.8% |
| Africans | 17.6 /100 | #206 | Poor 95.8% |
| Navajo | 17.0 /100 | #207 | Poor 95.8% |
| Immigrants | Sudan | 17.0 /100 | #208 | Poor 95.8% |
| Dutch West Indians | 16.1 /100 | #209 | Poor 95.8% |
| Hawaiians | 16.0 /100 | #210 | Poor 95.8% |
| Portuguese | 13.6 /100 | #211 | Poor 95.8% |
| Immigrants | Lebanon | 13.0 /100 | #212 | Poor 95.8% |
| Immigrants | Morocco | 12.6 /100 | #213 | Poor 95.8% |
| Bahamians | 11.6 /100 | #214 | Poor 95.7% |
Demographics Similar to Central Americans by 7th Grade
In terms of 7th grade, the demographic groups most similar to Central Americans are Immigrants from Latin America (92.2%, a difference of 0.13%), Mexican (91.9%, a difference of 0.25%), Immigrants from Honduras (92.5%, a difference of 0.40%), Yakama (91.7%, a difference of 0.44%), and Guatemalan (91.7%, a difference of 0.46%).
| Demographics | Rating | Rank | 7th Grade |
| Hondurans | 0.0 /100 | #331 | Tragic 92.9% |
| Hispanics or Latinos | 0.0 /100 | #332 | Tragic 92.7% |
| Immigrants | Armenia | 0.0 /100 | #333 | Tragic 92.7% |
| Immigrants | Yemen | 0.0 /100 | #334 | Tragic 92.6% |
| Mexican American Indians | 0.0 /100 | #335 | Tragic 92.6% |
| Immigrants | Honduras | 0.0 /100 | #336 | Tragic 92.5% |
| Immigrants | Latin America | 0.0 /100 | #337 | Tragic 92.2% |
| Central Americans | 0.0 /100 | #338 | Tragic 92.1% |
| Mexicans | 0.0 /100 | #339 | Tragic 91.9% |
| Yakama | 0.0 /100 | #340 | Tragic 91.7% |
| Guatemalans | 0.0 /100 | #341 | Tragic 91.7% |
| Salvadorans | 0.0 /100 | #342 | Tragic 91.5% |
| Immigrants | Guatemala | 0.0 /100 | #343 | Tragic 91.3% |
| Immigrants | Central America | 0.0 /100 | #344 | Tragic 91.0% |
| Immigrants | El Salvador | 0.0 /100 | #345 | Tragic 90.9% |