Turkish vs Immigrants from Bahamas Master's Degree
COMPARE
Turkish
Immigrants from Bahamas
Master's Degree
Master's Degree Comparison
Turks
Immigrants from Bahamas
19.9%
MASTER'S DEGREE
100.0/ 100
METRIC RATING
28th/ 347
METRIC RANK
12.9%
MASTER'S DEGREE
1.4/ 100
METRIC RATING
245th/ 347
METRIC RANK
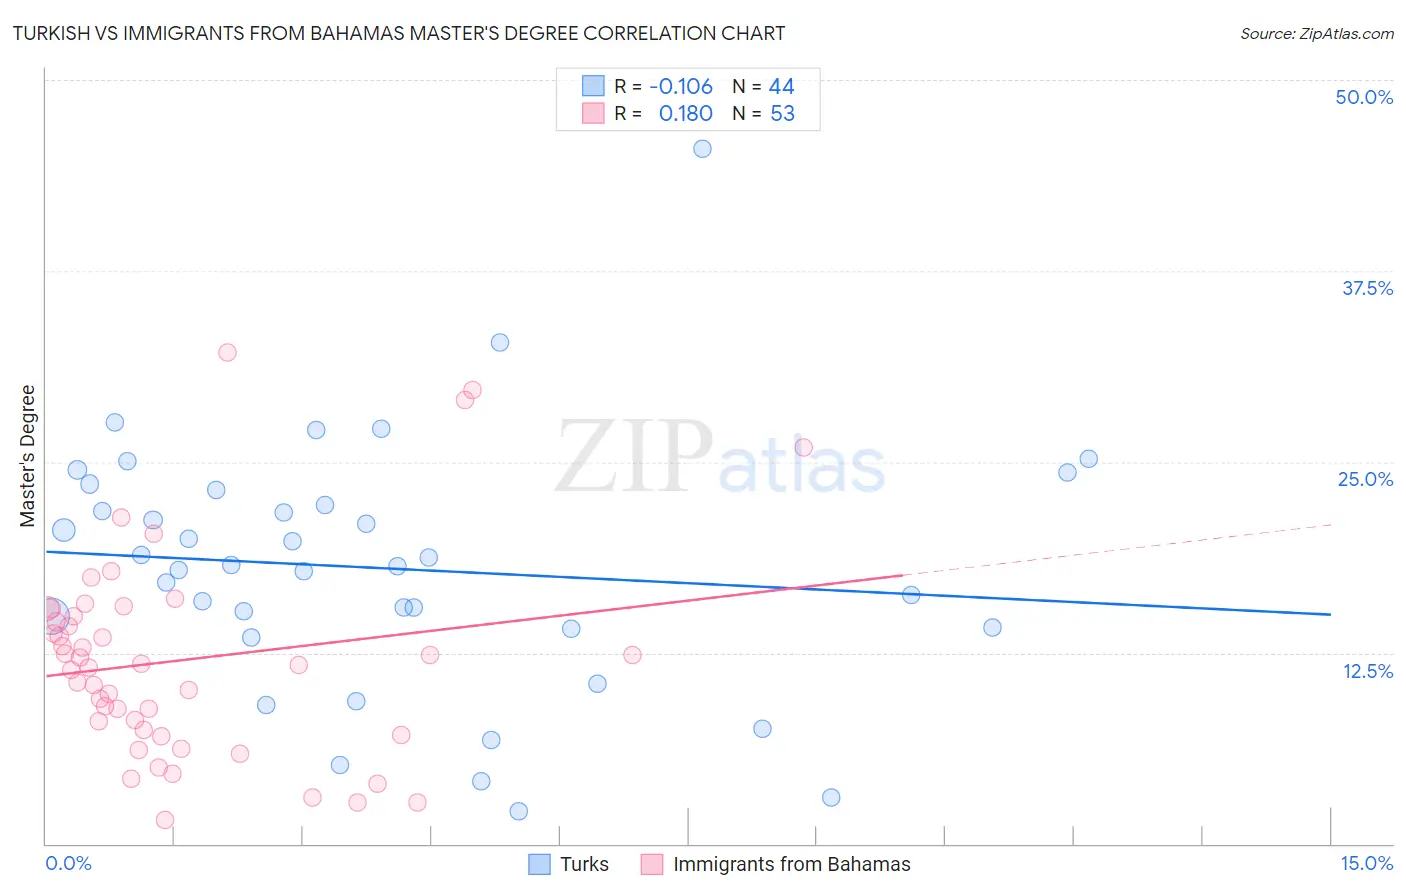
Turkish vs Immigrants from Bahamas Master's Degree Correlation Chart
The statistical analysis conducted on geographies consisting of 271,799,708 people shows a poor negative correlation between the proportion of Turks and percentage of population with at least master's degree education in the United States with a correlation coefficient (R) of -0.106 and weighted average of 19.9%. Similarly, the statistical analysis conducted on geographies consisting of 104,646,319 people shows a poor positive correlation between the proportion of Immigrants from Bahamas and percentage of population with at least master's degree education in the United States with a correlation coefficient (R) of 0.180 and weighted average of 12.9%, a difference of 54.2%.
Master's Degree Correlation Summary
| Measurement | Turkish | Immigrants from Bahamas |
| Minimum | 2.1% | 1.6% |
| Maximum | 45.5% | 32.1% |
| Range | 43.4% | 30.6% |
| Mean | 18.0% | 12.0% |
| Median | 18.2% | 11.7% |
| Interquartile 25% (IQ1) | 14.1% | 7.3% |
| Interquartile 75% (IQ3) | 22.6% | 15.1% |
| Interquartile Range (IQR) | 8.6% | 7.9% |
| Standard Deviation (Sample) | 8.2% | 6.7% |
| Standard Deviation (Population) | 8.2% | 6.7% |
Similar Demographics by Master's Degree
Demographics Similar to Turks by Master's Degree
In terms of master's degree, the demographic groups most similar to Turks are Immigrants from Sri Lanka (19.9%, a difference of 0.070%), Latvian (19.8%, a difference of 0.41%), Cambodian (20.0%, a difference of 0.48%), Immigrants from Japan (20.0%, a difference of 0.58%), and Immigrants from Turkey (19.7%, a difference of 0.92%).
| Demographics | Rating | Rank | Master's Degree |
| Immigrants | Ireland | 100.0 /100 | #21 | Exceptional 20.4% |
| Israelis | 100.0 /100 | #22 | Exceptional 20.3% |
| Immigrants | France | 100.0 /100 | #23 | Exceptional 20.3% |
| Immigrants | Sweden | 100.0 /100 | #24 | Exceptional 20.3% |
| Immigrants | Japan | 100.0 /100 | #25 | Exceptional 20.0% |
| Cambodians | 100.0 /100 | #26 | Exceptional 20.0% |
| Immigrants | Sri Lanka | 100.0 /100 | #27 | Exceptional 19.9% |
| Turks | 100.0 /100 | #28 | Exceptional 19.9% |
| Latvians | 100.0 /100 | #29 | Exceptional 19.8% |
| Immigrants | Turkey | 100.0 /100 | #30 | Exceptional 19.7% |
| Immigrants | Korea | 100.0 /100 | #31 | Exceptional 19.7% |
| Burmese | 100.0 /100 | #32 | Exceptional 19.7% |
| Russians | 100.0 /100 | #33 | Exceptional 19.5% |
| Immigrants | Denmark | 100.0 /100 | #34 | Exceptional 19.5% |
| Immigrants | Northern Europe | 100.0 /100 | #35 | Exceptional 19.5% |
Demographics Similar to Immigrants from Bahamas by Master's Degree
In terms of master's degree, the demographic groups most similar to Immigrants from Bahamas are Immigrants from Cambodia (12.9%, a difference of 0.040%), Iroquois (12.9%, a difference of 0.070%), African (12.9%, a difference of 0.16%), Cree (12.8%, a difference of 0.47%), and Liberian (12.8%, a difference of 0.47%).
| Demographics | Rating | Rank | Master's Degree |
| Hmong | 4.0 /100 | #238 | Tragic 13.4% |
| Immigrants | Nonimmigrants | 3.4 /100 | #239 | Tragic 13.3% |
| Guamanians/Chamorros | 2.2 /100 | #240 | Tragic 13.1% |
| U.S. Virgin Islanders | 2.1 /100 | #241 | Tragic 13.1% |
| Spanish Americans | 1.9 /100 | #242 | Tragic 13.0% |
| Immigrants | Jamaica | 1.9 /100 | #243 | Tragic 13.0% |
| Delaware | 1.7 /100 | #244 | Tragic 13.0% |
| Immigrants | Bahamas | 1.4 /100 | #245 | Tragic 12.9% |
| Immigrants | Cambodia | 1.4 /100 | #246 | Tragic 12.9% |
| Iroquois | 1.4 /100 | #247 | Tragic 12.9% |
| Africans | 1.4 /100 | #248 | Tragic 12.9% |
| Cree | 1.3 /100 | #249 | Tragic 12.8% |
| Liberians | 1.3 /100 | #250 | Tragic 12.8% |
| Tlingit-Haida | 1.3 /100 | #251 | Tragic 12.8% |
| French American Indians | 1.0 /100 | #252 | Tragic 12.7% |