Tsimshian vs Immigrants from Lebanon 6th Grade
COMPARE
Tsimshian
Immigrants from Lebanon
6th Grade
6th Grade Comparison
Tsimshian
Immigrants from Lebanon
98.3%
6TH GRADE
100.0/ 100
METRIC RATING
5th/ 347
METRIC RANK
96.9%
6TH GRADE
25.6/ 100
METRIC RATING
194th/ 347
METRIC RANK
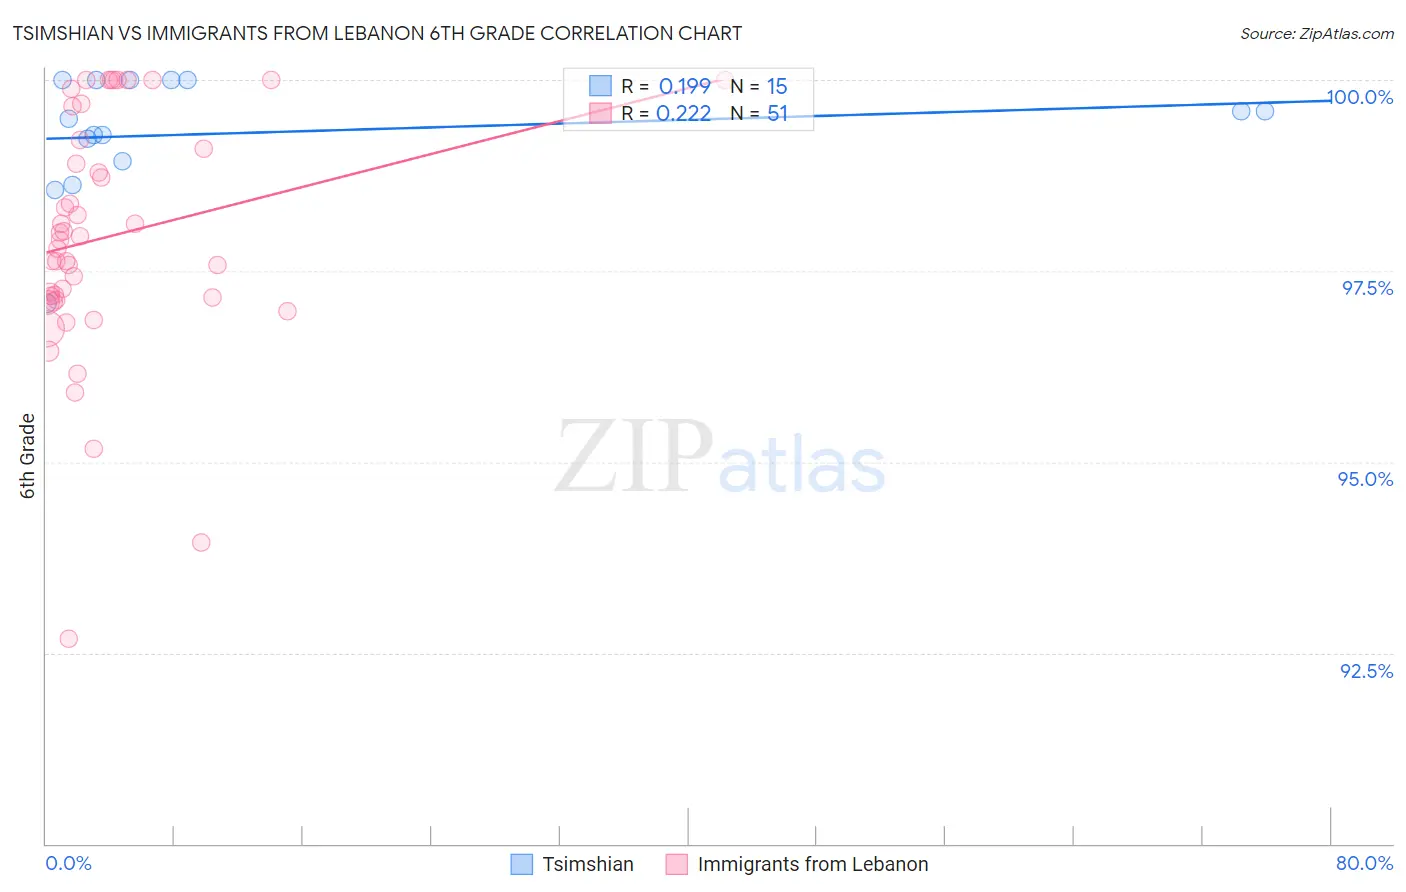
Tsimshian vs Immigrants from Lebanon 6th Grade Correlation Chart
The statistical analysis conducted on geographies consisting of 15,626,544 people shows a poor positive correlation between the proportion of Tsimshian and percentage of population with at least 6th grade education in the United States with a correlation coefficient (R) of 0.199 and weighted average of 98.3%. Similarly, the statistical analysis conducted on geographies consisting of 217,102,284 people shows a weak positive correlation between the proportion of Immigrants from Lebanon and percentage of population with at least 6th grade education in the United States with a correlation coefficient (R) of 0.222 and weighted average of 96.9%, a difference of 1.4%.
6th Grade Correlation Summary
| Measurement | Tsimshian | Immigrants from Lebanon |
| Minimum | 97.1% | 92.7% |
| Maximum | 100.0% | 100.0% |
| Range | 2.9% | 7.3% |
| Mean | 99.3% | 97.9% |
| Median | 99.5% | 97.9% |
| Interquartile 25% (IQ1) | 98.9% | 97.1% |
| Interquartile 75% (IQ3) | 100.0% | 99.2% |
| Interquartile Range (IQR) | 1.1% | 2.1% |
| Standard Deviation (Sample) | 0.79% | 1.6% |
| Standard Deviation (Population) | 0.76% | 1.6% |
Similar Demographics by 6th Grade
Demographics Similar to Tsimshian by 6th Grade
In terms of 6th grade, the demographic groups most similar to Tsimshian are Norwegian (98.3%, a difference of 0.0%), German (98.2%, a difference of 0.040%), Slovak (98.2%, a difference of 0.050%), Dutch (98.4%, a difference of 0.070%), and Slovene (98.2%, a difference of 0.10%).
| Demographics | Rating | Rank | 6th Grade |
| Crow | 100.0 /100 | #1 | Exceptional 99.4% |
| Ottawa | 100.0 /100 | #2 | Exceptional 98.5% |
| Welsh | 100.0 /100 | #3 | Exceptional 98.5% |
| Dutch | 100.0 /100 | #4 | Exceptional 98.4% |
| Tsimshian | 100.0 /100 | #5 | Exceptional 98.3% |
| Norwegians | 100.0 /100 | #6 | Exceptional 98.3% |
| Germans | 100.0 /100 | #7 | Exceptional 98.2% |
| Slovaks | 100.0 /100 | #8 | Exceptional 98.2% |
| Slovenes | 100.0 /100 | #9 | Exceptional 98.2% |
| Swedes | 100.0 /100 | #10 | Exceptional 98.2% |
| English | 100.0 /100 | #11 | Exceptional 98.1% |
| Alaskan Athabascans | 100.0 /100 | #12 | Exceptional 98.1% |
| Tlingit-Haida | 100.0 /100 | #13 | Exceptional 98.1% |
| Carpatho Rusyns | 100.0 /100 | #14 | Exceptional 98.1% |
| Inupiat | 100.0 /100 | #15 | Exceptional 98.1% |
Demographics Similar to Immigrants from Lebanon by 6th Grade
In terms of 6th grade, the demographic groups most similar to Immigrants from Lebanon are Immigrants from Brazil (96.9%, a difference of 0.0%), Panamanian (96.9%, a difference of 0.010%), Hawaiian (96.9%, a difference of 0.010%), Paraguayan (96.9%, a difference of 0.010%), and Dutch West Indian (96.9%, a difference of 0.020%).
| Demographics | Rating | Rank | 6th Grade |
| Guamanians/Chamorros | 30.6 /100 | #187 | Fair 97.0% |
| Immigrants | Argentina | 30.4 /100 | #188 | Fair 97.0% |
| Blacks/African Americans | 30.2 /100 | #189 | Fair 97.0% |
| Dutch West Indians | 28.3 /100 | #190 | Fair 96.9% |
| Panamanians | 27.3 /100 | #191 | Fair 96.9% |
| Hawaiians | 27.0 /100 | #192 | Fair 96.9% |
| Paraguayans | 26.6 /100 | #193 | Fair 96.9% |
| Immigrants | Lebanon | 25.6 /100 | #194 | Fair 96.9% |
| Immigrants | Brazil | 25.5 /100 | #195 | Fair 96.9% |
| Immigrants | Uganda | 21.2 /100 | #196 | Fair 96.9% |
| Brazilians | 20.1 /100 | #197 | Fair 96.9% |
| Immigrants | Albania | 18.8 /100 | #198 | Poor 96.9% |
| Immigrants | Northern Africa | 15.7 /100 | #199 | Poor 96.9% |
| Africans | 14.8 /100 | #200 | Poor 96.9% |
| Immigrants | Zaire | 14.5 /100 | #201 | Poor 96.9% |