Tsimshian vs Russian 6th Grade
COMPARE
Tsimshian
Russian
6th Grade
6th Grade Comparison
Tsimshian
Russians
98.3%
6TH GRADE
100.0/ 100
METRIC RATING
5th/ 347
METRIC RANK
97.7%
6TH GRADE
99.7/ 100
METRIC RATING
63rd/ 347
METRIC RANK
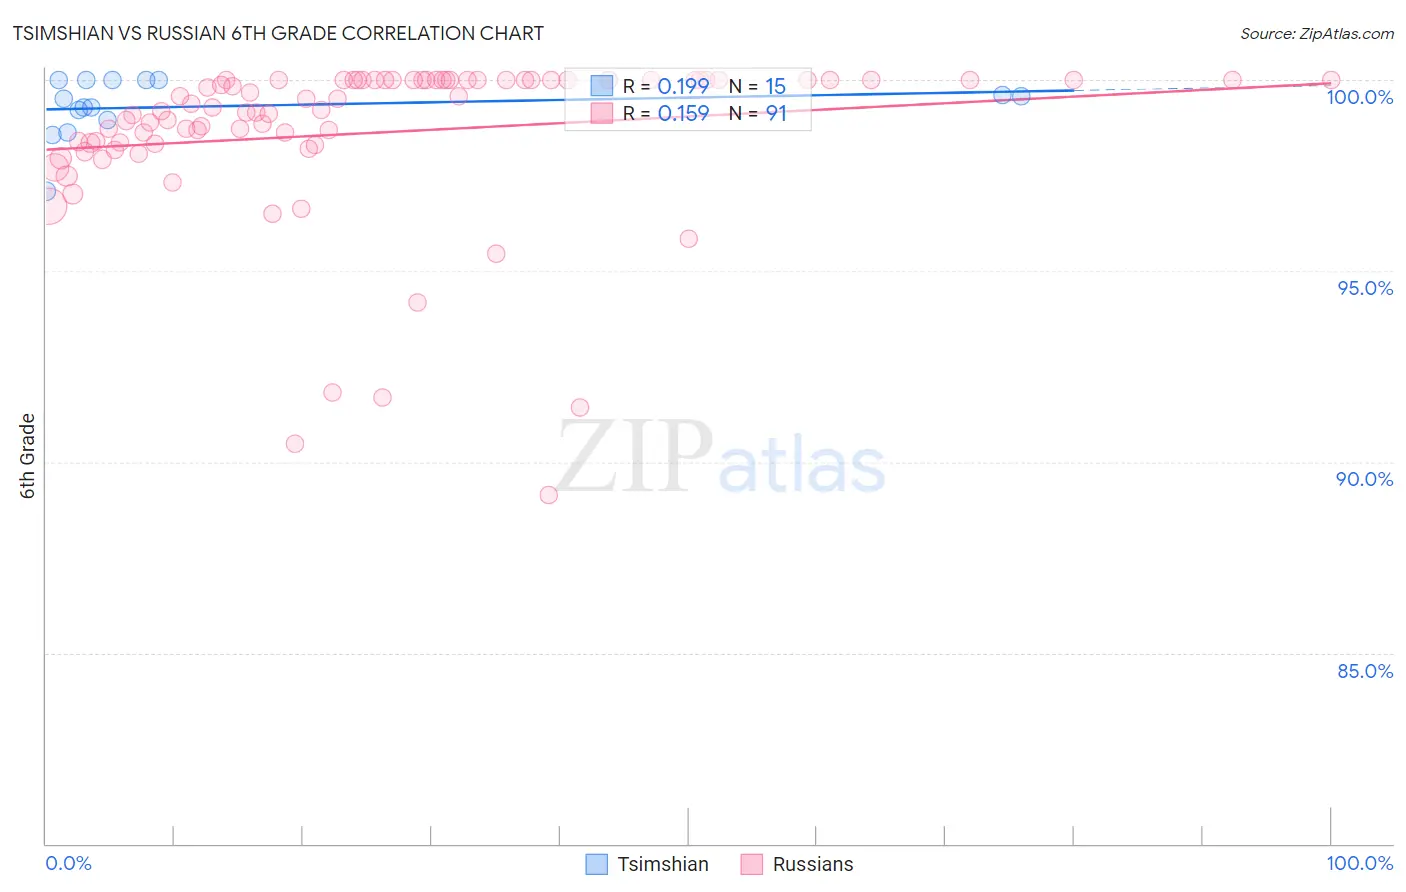
Tsimshian vs Russian 6th Grade Correlation Chart
The statistical analysis conducted on geographies consisting of 15,626,544 people shows a poor positive correlation between the proportion of Tsimshian and percentage of population with at least 6th grade education in the United States with a correlation coefficient (R) of 0.199 and weighted average of 98.3%. Similarly, the statistical analysis conducted on geographies consisting of 512,259,047 people shows a poor positive correlation between the proportion of Russians and percentage of population with at least 6th grade education in the United States with a correlation coefficient (R) of 0.159 and weighted average of 97.7%, a difference of 0.61%.
6th Grade Correlation Summary
| Measurement | Tsimshian | Russian |
| Minimum | 97.1% | 89.1% |
| Maximum | 100.0% | 100.0% |
| Range | 2.9% | 10.9% |
| Mean | 99.3% | 98.6% |
| Median | 99.5% | 99.3% |
| Interquartile 25% (IQ1) | 98.9% | 98.3% |
| Interquartile 75% (IQ3) | 100.0% | 100.0% |
| Interquartile Range (IQR) | 1.1% | 1.7% |
| Standard Deviation (Sample) | 0.79% | 2.2% |
| Standard Deviation (Population) | 0.76% | 2.2% |
Similar Demographics by 6th Grade
Demographics Similar to Tsimshian by 6th Grade
In terms of 6th grade, the demographic groups most similar to Tsimshian are Norwegian (98.3%, a difference of 0.0%), German (98.2%, a difference of 0.040%), Slovak (98.2%, a difference of 0.050%), Dutch (98.4%, a difference of 0.070%), and Slovene (98.2%, a difference of 0.10%).
| Demographics | Rating | Rank | 6th Grade |
| Crow | 100.0 /100 | #1 | Exceptional 99.4% |
| Ottawa | 100.0 /100 | #2 | Exceptional 98.5% |
| Welsh | 100.0 /100 | #3 | Exceptional 98.5% |
| Dutch | 100.0 /100 | #4 | Exceptional 98.4% |
| Tsimshian | 100.0 /100 | #5 | Exceptional 98.3% |
| Norwegians | 100.0 /100 | #6 | Exceptional 98.3% |
| Germans | 100.0 /100 | #7 | Exceptional 98.2% |
| Slovaks | 100.0 /100 | #8 | Exceptional 98.2% |
| Slovenes | 100.0 /100 | #9 | Exceptional 98.2% |
| Swedes | 100.0 /100 | #10 | Exceptional 98.2% |
| English | 100.0 /100 | #11 | Exceptional 98.1% |
| Alaskan Athabascans | 100.0 /100 | #12 | Exceptional 98.1% |
| Tlingit-Haida | 100.0 /100 | #13 | Exceptional 98.1% |
| Carpatho Rusyns | 100.0 /100 | #14 | Exceptional 98.1% |
| Inupiat | 100.0 /100 | #15 | Exceptional 98.1% |
Demographics Similar to Russians by 6th Grade
In terms of 6th grade, the demographic groups most similar to Russians are Immigrants from North America (97.7%, a difference of 0.010%), Canadian (97.7%, a difference of 0.010%), Immigrants from Canada (97.7%, a difference of 0.020%), Serbian (97.7%, a difference of 0.020%), and Immigrants from Northern Europe (97.7%, a difference of 0.020%).
| Demographics | Rating | Rank | 6th Grade |
| Austrians | 99.8 /100 | #56 | Exceptional 97.7% |
| Whites/Caucasians | 99.8 /100 | #57 | Exceptional 97.7% |
| Greeks | 99.8 /100 | #58 | Exceptional 97.7% |
| Americans | 99.8 /100 | #59 | Exceptional 97.7% |
| Immigrants | Canada | 99.8 /100 | #60 | Exceptional 97.7% |
| Serbians | 99.7 /100 | #61 | Exceptional 97.7% |
| Immigrants | North America | 99.7 /100 | #62 | Exceptional 97.7% |
| Russians | 99.7 /100 | #63 | Exceptional 97.7% |
| Canadians | 99.7 /100 | #64 | Exceptional 97.7% |
| Immigrants | Northern Europe | 99.6 /100 | #65 | Exceptional 97.7% |
| New Zealanders | 99.6 /100 | #66 | Exceptional 97.7% |
| Kiowa | 99.6 /100 | #67 | Exceptional 97.7% |
| Immigrants | Austria | 99.6 /100 | #68 | Exceptional 97.7% |
| Iranians | 99.6 /100 | #69 | Exceptional 97.6% |
| Cajuns | 99.5 /100 | #70 | Exceptional 97.6% |