Tsimshian vs Immigrants from Bahamas 5th Grade
COMPARE
Tsimshian
Immigrants from Bahamas
5th Grade
5th Grade Comparison
Tsimshian
Immigrants from Bahamas
98.4%
5TH GRADE
100.0/ 100
METRIC RATING
4th/ 347
METRIC RANK
97.2%
5TH GRADE
14.9/ 100
METRIC RATING
203rd/ 347
METRIC RANK
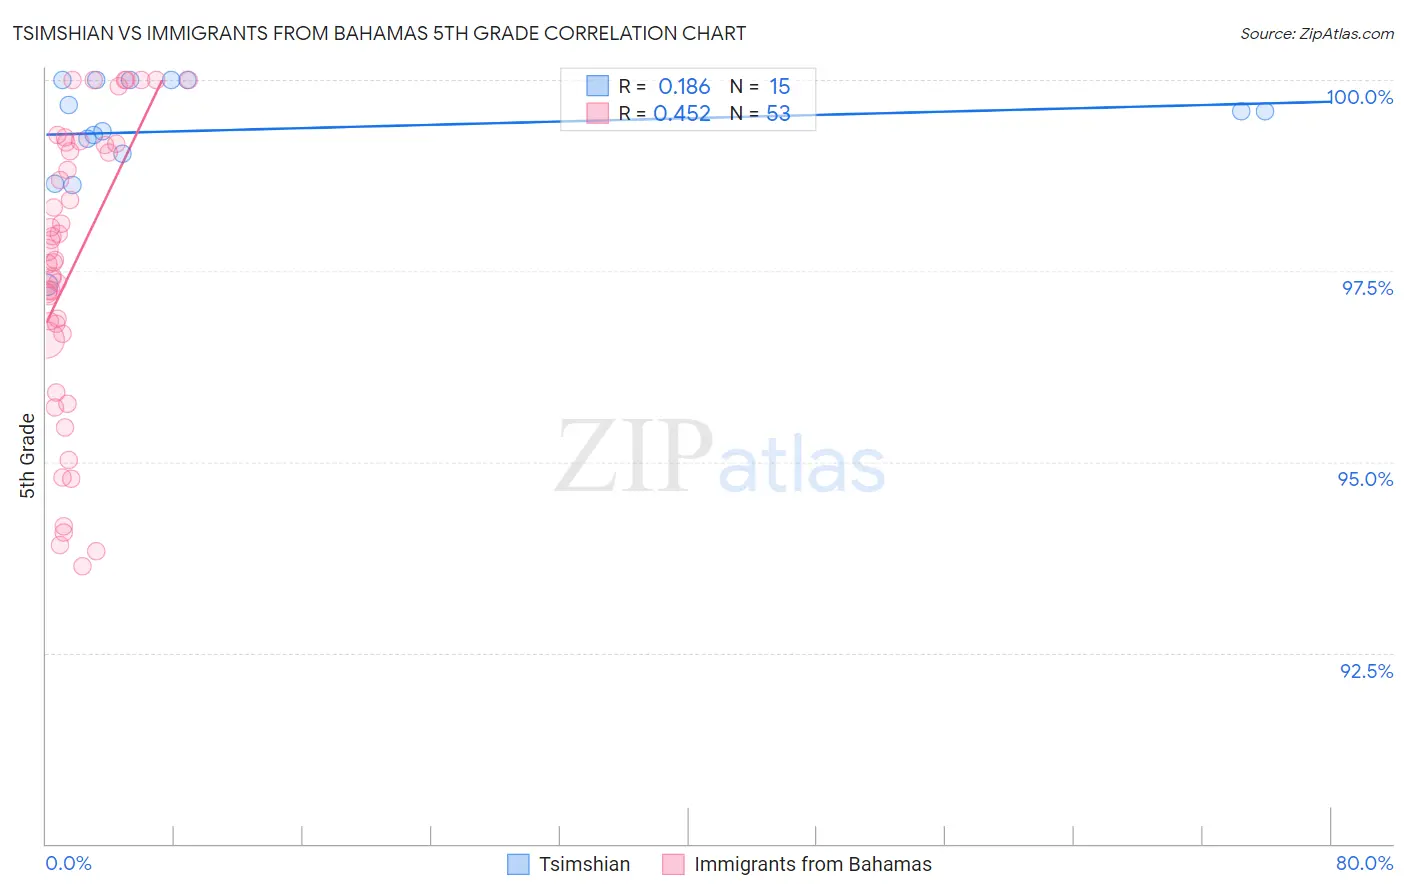
Tsimshian vs Immigrants from Bahamas 5th Grade Correlation Chart
The statistical analysis conducted on geographies consisting of 15,626,544 people shows a poor positive correlation between the proportion of Tsimshian and percentage of population with at least 5th grade education in the United States with a correlation coefficient (R) of 0.186 and weighted average of 98.4%. Similarly, the statistical analysis conducted on geographies consisting of 104,665,087 people shows a moderate positive correlation between the proportion of Immigrants from Bahamas and percentage of population with at least 5th grade education in the United States with a correlation coefficient (R) of 0.452 and weighted average of 97.2%, a difference of 1.3%.
5th Grade Correlation Summary
| Measurement | Tsimshian | Immigrants from Bahamas |
| Minimum | 97.3% | 93.6% |
| Maximum | 100.0% | 100.0% |
| Range | 2.7% | 6.4% |
| Mean | 99.4% | 97.5% |
| Median | 99.6% | 97.7% |
| Interquartile 25% (IQ1) | 99.0% | 96.6% |
| Interquartile 75% (IQ3) | 100.0% | 99.2% |
| Interquartile Range (IQR) | 0.97% | 2.5% |
| Standard Deviation (Sample) | 0.74% | 1.9% |
| Standard Deviation (Population) | 0.71% | 1.8% |
Similar Demographics by 5th Grade
Demographics Similar to Tsimshian by 5th Grade
In terms of 5th grade, the demographic groups most similar to Tsimshian are Norwegian (98.4%, a difference of 0.0%), Slovak (98.4%, a difference of 0.020%), German (98.4%, a difference of 0.020%), Inupiat (98.4%, a difference of 0.050%), and Slovene (98.3%, a difference of 0.070%).
| Demographics | Rating | Rank | 5th Grade |
| Crow | 100.0 /100 | #1 | Exceptional 99.5% |
| Welsh | 100.0 /100 | #2 | Exceptional 98.6% |
| Norwegians | 100.0 /100 | #3 | Exceptional 98.4% |
| Tsimshian | 100.0 /100 | #4 | Exceptional 98.4% |
| Slovaks | 100.0 /100 | #5 | Exceptional 98.4% |
| Germans | 100.0 /100 | #6 | Exceptional 98.4% |
| Inupiat | 100.0 /100 | #7 | Exceptional 98.4% |
| Slovenes | 100.0 /100 | #8 | Exceptional 98.3% |
| Swedes | 100.0 /100 | #9 | Exceptional 98.3% |
| English | 100.0 /100 | #10 | Exceptional 98.3% |
| Alaskan Athabascans | 100.0 /100 | #11 | Exceptional 98.3% |
| Carpatho Rusyns | 100.0 /100 | #12 | Exceptional 98.3% |
| Tlingit-Haida | 100.0 /100 | #13 | Exceptional 98.3% |
| Dutch | 100.0 /100 | #14 | Exceptional 98.3% |
| Scottish | 100.0 /100 | #15 | Exceptional 98.3% |
Demographics Similar to Immigrants from Bahamas by 5th Grade
In terms of 5th grade, the demographic groups most similar to Immigrants from Bahamas are African (97.2%, a difference of 0.0%), Immigrants from Northern Africa (97.2%, a difference of 0.010%), Immigrants from Chile (97.2%, a difference of 0.010%), Immigrants from Zaire (97.1%, a difference of 0.010%), and Native/Alaskan (97.2%, a difference of 0.020%).
| Demographics | Rating | Rank | 5th Grade |
| Hawaiians | 25.6 /100 | #196 | Fair 97.2% |
| Brazilians | 25.4 /100 | #197 | Fair 97.2% |
| Immigrants | Uganda | 21.1 /100 | #198 | Fair 97.2% |
| Natives/Alaskans | 18.0 /100 | #199 | Poor 97.2% |
| Immigrants | Northern Africa | 16.8 /100 | #200 | Poor 97.2% |
| Immigrants | Chile | 16.6 /100 | #201 | Poor 97.2% |
| Africans | 15.3 /100 | #202 | Poor 97.2% |
| Immigrants | Bahamas | 14.9 /100 | #203 | Poor 97.2% |
| Immigrants | Zaire | 13.7 /100 | #204 | Poor 97.1% |
| Moroccans | 12.0 /100 | #205 | Poor 97.1% |
| Paiute | 11.6 /100 | #206 | Poor 97.1% |
| Iraqis | 10.9 /100 | #207 | Poor 97.1% |
| Laotians | 10.8 /100 | #208 | Poor 97.1% |
| Immigrants | Nepal | 10.3 /100 | #209 | Poor 97.1% |
| Immigrants | Oceania | 10.0 /100 | #210 | Poor 97.1% |