Tsimshian vs Immigrants from Peru 9th Grade
COMPARE
Tsimshian
Immigrants from Peru
9th Grade
9th Grade Comparison
Tsimshian
Immigrants from Peru
97.0%
9TH GRADE
100.0/ 100
METRIC RATING
1st/ 347
METRIC RANK
93.4%
9TH GRADE
0.0/ 100
METRIC RATING
285th/ 347
METRIC RANK
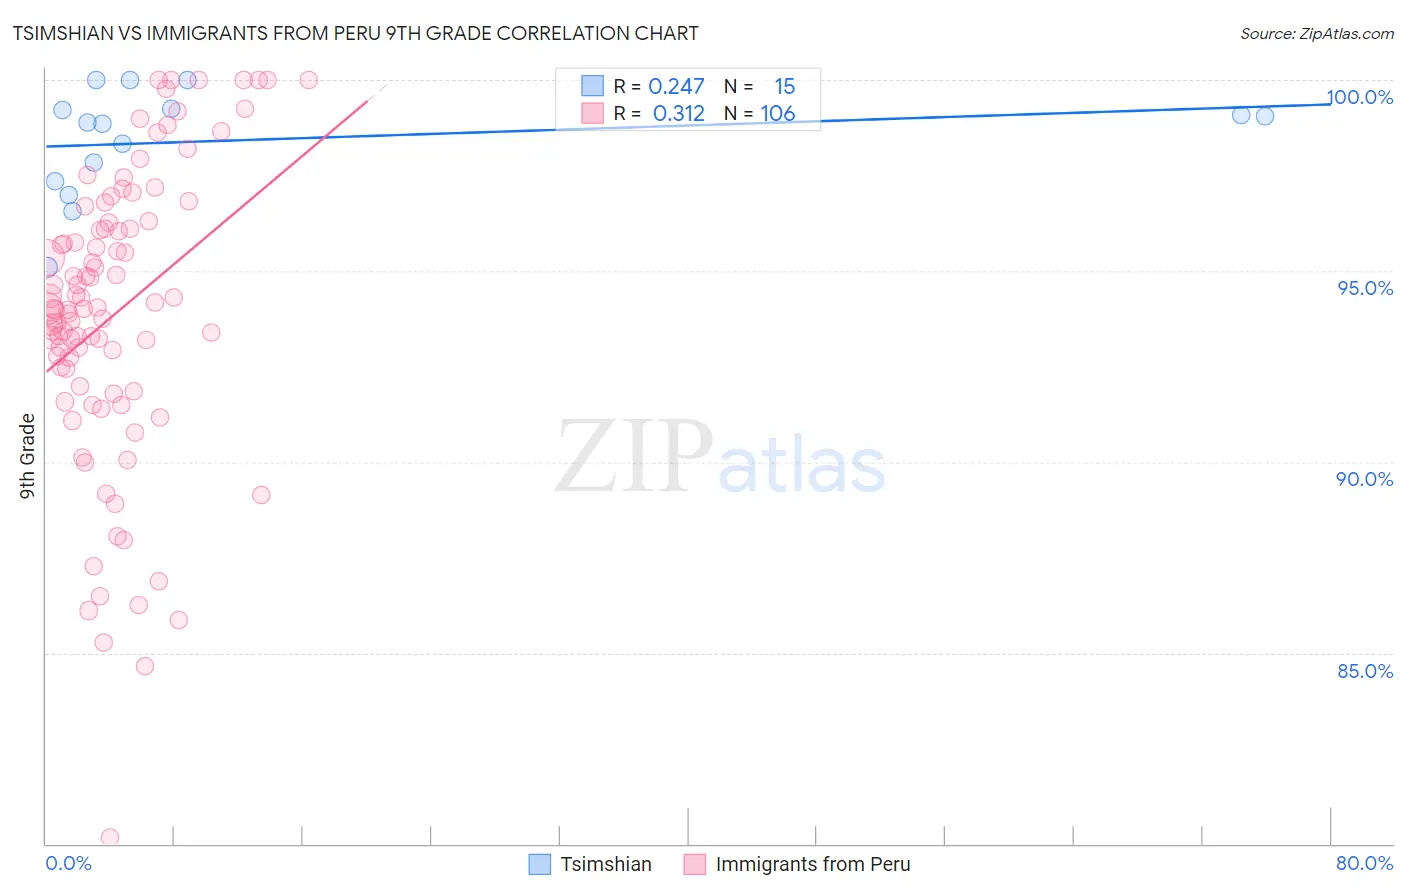
Tsimshian vs Immigrants from Peru 9th Grade Correlation Chart
The statistical analysis conducted on geographies consisting of 15,626,544 people shows a weak positive correlation between the proportion of Tsimshian and percentage of population with at least 9th grade education in the United States with a correlation coefficient (R) of 0.247 and weighted average of 97.0%. Similarly, the statistical analysis conducted on geographies consisting of 328,860,880 people shows a mild positive correlation between the proportion of Immigrants from Peru and percentage of population with at least 9th grade education in the United States with a correlation coefficient (R) of 0.312 and weighted average of 93.4%, a difference of 3.9%.
9th Grade Correlation Summary
| Measurement | Tsimshian | Immigrants from Peru |
| Minimum | 95.1% | 80.2% |
| Maximum | 100.0% | 100.0% |
| Range | 4.9% | 19.8% |
| Mean | 98.4% | 93.9% |
| Median | 98.9% | 94.0% |
| Interquartile 25% (IQ1) | 97.4% | 92.0% |
| Interquartile 75% (IQ3) | 99.2% | 96.3% |
| Interquartile Range (IQR) | 1.9% | 4.3% |
| Standard Deviation (Sample) | 1.4% | 3.9% |
| Standard Deviation (Population) | 1.4% | 3.8% |
Similar Demographics by 9th Grade
Demographics Similar to Tsimshian by 9th Grade
In terms of 9th grade, the demographic groups most similar to Tsimshian are Norwegian (96.9%, a difference of 0.090%), Slovak (96.9%, a difference of 0.14%), Slovene (96.7%, a difference of 0.27%), Swedish (96.7%, a difference of 0.28%), and Polish (96.7%, a difference of 0.29%).
| Demographics | Rating | Rank | 9th Grade |
| Tsimshian | 100.0 /100 | #1 | Exceptional 97.0% |
| Norwegians | 100.0 /100 | #2 | Exceptional 96.9% |
| Slovaks | 100.0 /100 | #3 | Exceptional 96.9% |
| Slovenes | 100.0 /100 | #4 | Exceptional 96.7% |
| Swedes | 100.0 /100 | #5 | Exceptional 96.7% |
| Poles | 100.0 /100 | #6 | Exceptional 96.7% |
| Carpatho Rusyns | 100.0 /100 | #7 | Exceptional 96.7% |
| Germans | 100.0 /100 | #8 | Exceptional 96.7% |
| Tlingit-Haida | 100.0 /100 | #9 | Exceptional 96.6% |
| Lithuanians | 100.0 /100 | #10 | Exceptional 96.6% |
| Finns | 100.0 /100 | #11 | Exceptional 96.6% |
| English | 100.0 /100 | #12 | Exceptional 96.6% |
| Danes | 100.0 /100 | #13 | Exceptional 96.5% |
| Scottish | 100.0 /100 | #14 | Exceptional 96.5% |
| Irish | 100.0 /100 | #15 | Exceptional 96.5% |
Demographics Similar to Immigrants from Peru by 9th Grade
In terms of 9th grade, the demographic groups most similar to Immigrants from Peru are Bangladeshi (93.4%, a difference of 0.040%), Immigrants from Barbados (93.4%, a difference of 0.040%), Immigrants from St. Vincent and the Grenadines (93.4%, a difference of 0.040%), Immigrants from South Eastern Asia (93.3%, a difference of 0.070%), and Barbadian (93.5%, a difference of 0.11%).
| Demographics | Rating | Rank | 9th Grade |
| Immigrants | Eritrea | 0.1 /100 | #278 | Tragic 93.7% |
| Trinidadians and Tobagonians | 0.1 /100 | #279 | Tragic 93.7% |
| Taiwanese | 0.1 /100 | #280 | Tragic 93.6% |
| Immigrants | Trinidad and Tobago | 0.1 /100 | #281 | Tragic 93.6% |
| Malaysians | 0.0 /100 | #282 | Tragic 93.5% |
| Barbadians | 0.0 /100 | #283 | Tragic 93.5% |
| Bangladeshis | 0.0 /100 | #284 | Tragic 93.4% |
| Immigrants | Peru | 0.0 /100 | #285 | Tragic 93.4% |
| Immigrants | Barbados | 0.0 /100 | #286 | Tragic 93.4% |
| Immigrants | St. Vincent and the Grenadines | 0.0 /100 | #287 | Tragic 93.4% |
| Immigrants | South Eastern Asia | 0.0 /100 | #288 | Tragic 93.3% |
| Immigrants | West Indies | 0.0 /100 | #289 | Tragic 93.3% |
| Pennsylvania Germans | 0.0 /100 | #290 | Tragic 93.3% |
| British West Indians | 0.0 /100 | #291 | Tragic 93.2% |
| Immigrants | Laos | 0.0 /100 | #292 | Tragic 93.2% |