Immigrants from Eritrea vs Immigrants from Mexico 11th Grade
COMPARE
Immigrants from Eritrea
Immigrants from Mexico
11th Grade
11th Grade Comparison
Immigrants from Eritrea
Immigrants from Mexico
91.4%
11TH GRADE
0.7/ 100
METRIC RATING
254th/ 347
METRIC RANK
84.5%
11TH GRADE
0.0/ 100
METRIC RATING
347th/ 347
METRIC RANK
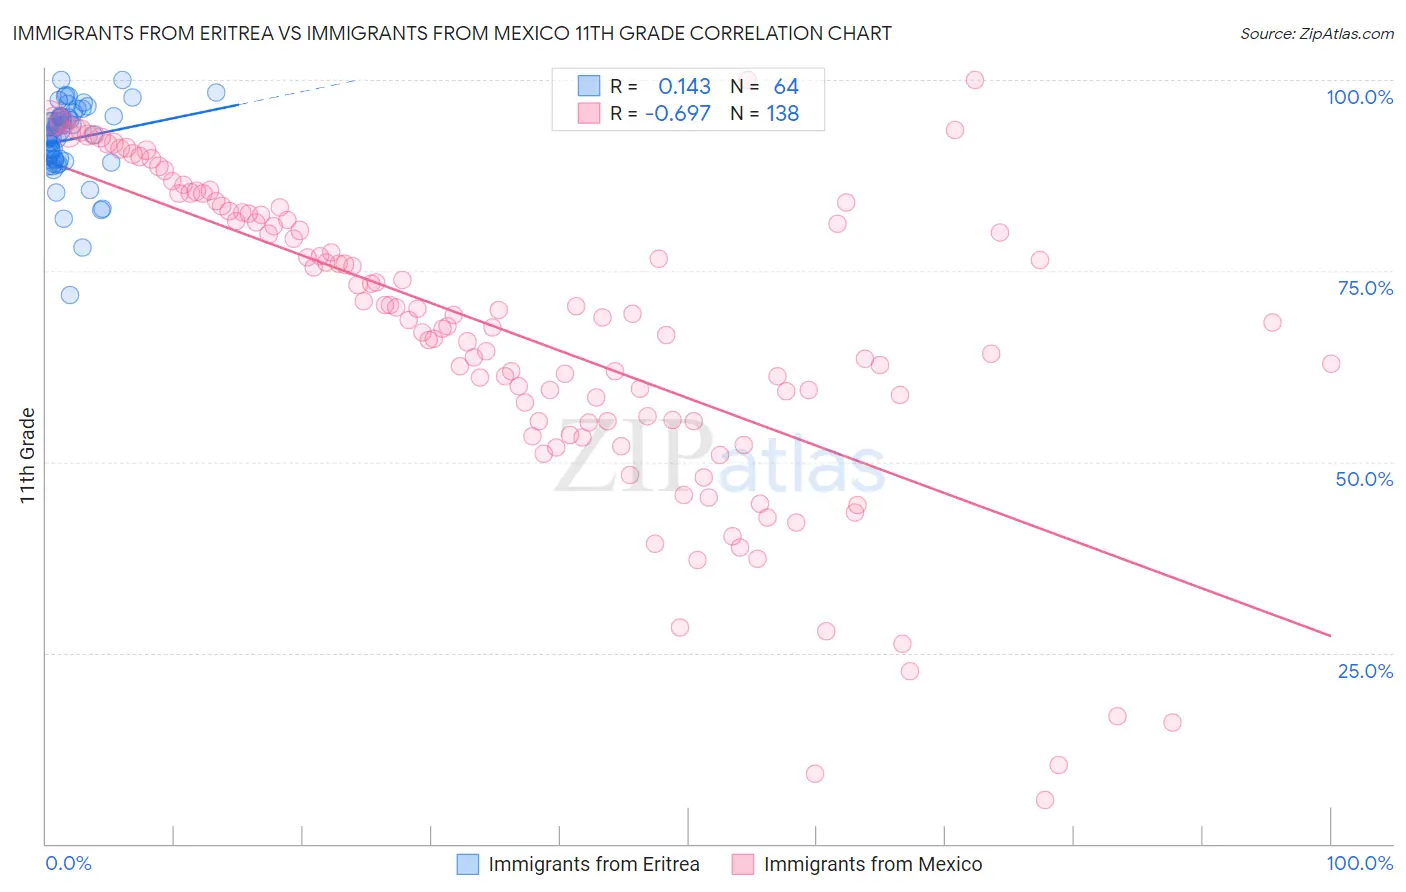
Immigrants from Eritrea vs Immigrants from Mexico 11th Grade Correlation Chart
The statistical analysis conducted on geographies consisting of 104,754,230 people shows a poor positive correlation between the proportion of Immigrants from Eritrea and percentage of population with at least 11th grade education in the United States with a correlation coefficient (R) of 0.143 and weighted average of 91.4%. Similarly, the statistical analysis conducted on geographies consisting of 513,766,645 people shows a significant negative correlation between the proportion of Immigrants from Mexico and percentage of population with at least 11th grade education in the United States with a correlation coefficient (R) of -0.697 and weighted average of 84.5%, a difference of 8.2%.
11th Grade Correlation Summary
| Measurement | Immigrants from Eritrea | Immigrants from Mexico |
| Minimum | 71.8% | 5.7% |
| Maximum | 100.0% | 100.0% |
| Range | 28.2% | 94.3% |
| Mean | 92.2% | 67.1% |
| Median | 93.1% | 69.1% |
| Interquartile 25% (IQ1) | 89.6% | 55.4% |
| Interquartile 75% (IQ3) | 95.2% | 82.6% |
| Interquartile Range (IQR) | 5.7% | 27.3% |
| Standard Deviation (Sample) | 5.1% | 20.2% |
| Standard Deviation (Population) | 5.1% | 20.1% |
Similar Demographics by 11th Grade
Demographics Similar to Immigrants from Eritrea by 11th Grade
In terms of 11th grade, the demographic groups most similar to Immigrants from Eritrea are Black/African American (91.4%, a difference of 0.010%), Immigrants from Senegal (91.4%, a difference of 0.010%), Immigrants from Nigeria (91.4%, a difference of 0.020%), Immigrants from South America (91.4%, a difference of 0.020%), and Cajun (91.4%, a difference of 0.020%).
| Demographics | Rating | Rank | 11th Grade |
| Immigrants | Philippines | 1.0 /100 | #247 | Tragic 91.5% |
| Immigrants | Uzbekistan | 1.0 /100 | #248 | Tragic 91.5% |
| Peruvians | 1.0 /100 | #249 | Tragic 91.5% |
| Ghanaians | 0.9 /100 | #250 | Tragic 91.5% |
| Immigrants | Costa Rica | 0.9 /100 | #251 | Tragic 91.4% |
| Immigrants | Nigeria | 0.8 /100 | #252 | Tragic 91.4% |
| Immigrants | South America | 0.8 /100 | #253 | Tragic 91.4% |
| Immigrants | Eritrea | 0.7 /100 | #254 | Tragic 91.4% |
| Blacks/African Americans | 0.7 /100 | #255 | Tragic 91.4% |
| Immigrants | Senegal | 0.7 /100 | #256 | Tragic 91.4% |
| Cajuns | 0.7 /100 | #257 | Tragic 91.4% |
| Immigrants | Colombia | 0.6 /100 | #258 | Tragic 91.4% |
| Jamaicans | 0.6 /100 | #259 | Tragic 91.4% |
| Spanish Americans | 0.6 /100 | #260 | Tragic 91.4% |
| Taiwanese | 0.6 /100 | #261 | Tragic 91.3% |
Demographics Similar to Immigrants from Mexico by 11th Grade
In terms of 11th grade, the demographic groups most similar to Immigrants from Mexico are Spanish American Indian (84.7%, a difference of 0.30%), Immigrants from Central America (84.9%, a difference of 0.54%), Yakama (85.0%, a difference of 0.57%), Immigrants from El Salvador (85.3%, a difference of 0.98%), and Immigrants from Guatemala (85.8%, a difference of 1.6%).
| Demographics | Rating | Rank | 11th Grade |
| Immigrants | Yemen | 0.0 /100 | #333 | Tragic 87.1% |
| Houma | 0.0 /100 | #334 | Tragic 87.0% |
| Central Americans | 0.0 /100 | #335 | Tragic 86.9% |
| Immigrants | Dominican Republic | 0.0 /100 | #336 | Tragic 86.9% |
| Immigrants | Honduras | 0.0 /100 | #337 | Tragic 86.9% |
| Immigrants | Latin America | 0.0 /100 | #338 | Tragic 86.8% |
| Guatemalans | 0.0 /100 | #339 | Tragic 86.4% |
| Salvadorans | 0.0 /100 | #340 | Tragic 86.2% |
| Mexicans | 0.0 /100 | #341 | Tragic 86.1% |
| Immigrants | Guatemala | 0.0 /100 | #342 | Tragic 85.8% |
| Immigrants | El Salvador | 0.0 /100 | #343 | Tragic 85.3% |
| Yakama | 0.0 /100 | #344 | Tragic 85.0% |
| Immigrants | Central America | 0.0 /100 | #345 | Tragic 84.9% |
| Spanish American Indians | 0.0 /100 | #346 | Tragic 84.7% |
| Immigrants | Mexico | 0.0 /100 | #347 | Tragic 84.5% |