Trinidadian and Tobagonian vs Immigrants from Bangladesh 3rd Grade
COMPARE
Trinidadian and Tobagonian
Immigrants from Bangladesh
3rd Grade
3rd Grade Comparison
Trinidadians and Tobagonians
Immigrants from Bangladesh
97.2%
3RD GRADE
0.1/ 100
METRIC RATING
277th/ 347
METRIC RANK
96.6%
3RD GRADE
0.0/ 100
METRIC RATING
317th/ 347
METRIC RANK
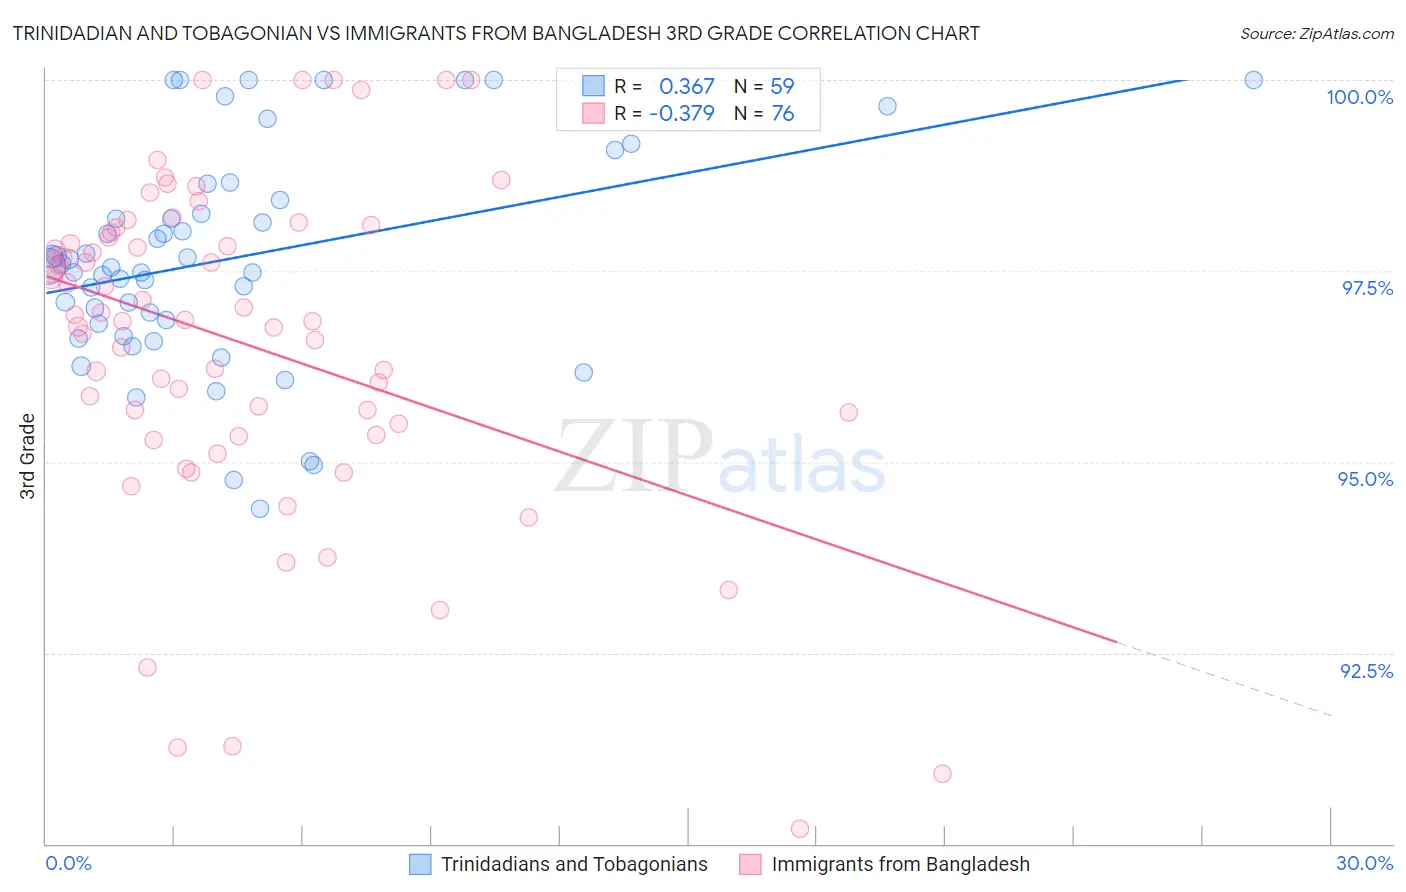
Trinidadian and Tobagonian vs Immigrants from Bangladesh 3rd Grade Correlation Chart
The statistical analysis conducted on geographies consisting of 219,882,819 people shows a mild positive correlation between the proportion of Trinidadians and Tobagonians and percentage of population with at least 3rd grade education in the United States with a correlation coefficient (R) of 0.367 and weighted average of 97.2%. Similarly, the statistical analysis conducted on geographies consisting of 203,681,254 people shows a mild negative correlation between the proportion of Immigrants from Bangladesh and percentage of population with at least 3rd grade education in the United States with a correlation coefficient (R) of -0.379 and weighted average of 96.6%, a difference of 0.64%.
3rd Grade Correlation Summary
| Measurement | Trinidadian and Tobagonian | Immigrants from Bangladesh |
| Minimum | 94.4% | 90.2% |
| Maximum | 100.0% | 100.0% |
| Range | 5.6% | 9.8% |
| Mean | 97.7% | 96.5% |
| Median | 97.6% | 96.9% |
| Interquartile 25% (IQ1) | 96.8% | 95.4% |
| Interquartile 75% (IQ3) | 98.4% | 98.0% |
| Interquartile Range (IQR) | 1.6% | 2.5% |
| Standard Deviation (Sample) | 1.4% | 2.2% |
| Standard Deviation (Population) | 1.4% | 2.2% |
Similar Demographics by 3rd Grade
Demographics Similar to Trinidadians and Tobagonians by 3rd Grade
In terms of 3rd grade, the demographic groups most similar to Trinidadians and Tobagonians are Immigrants from Bolivia (97.2%, a difference of 0.0%), Immigrants from Western Africa (97.2%, a difference of 0.0%), Immigrants from Philippines (97.2%, a difference of 0.010%), Immigrants from Ghana (97.2%, a difference of 0.010%), and Immigrants from Uzbekistan (97.2%, a difference of 0.020%).
| Demographics | Rating | Rank | 3rd Grade |
| Immigrants | China | 0.2 /100 | #270 | Tragic 97.2% |
| Puerto Ricans | 0.2 /100 | #271 | Tragic 97.2% |
| Ghanaians | 0.1 /100 | #272 | Tragic 97.2% |
| Immigrants | Peru | 0.1 /100 | #273 | Tragic 97.2% |
| Immigrants | Cameroon | 0.1 /100 | #274 | Tragic 97.2% |
| Immigrants | Uzbekistan | 0.1 /100 | #275 | Tragic 97.2% |
| Immigrants | Bolivia | 0.1 /100 | #276 | Tragic 97.2% |
| Trinidadians and Tobagonians | 0.1 /100 | #277 | Tragic 97.2% |
| Immigrants | Western Africa | 0.1 /100 | #278 | Tragic 97.2% |
| Immigrants | Philippines | 0.1 /100 | #279 | Tragic 97.2% |
| Immigrants | Ghana | 0.1 /100 | #280 | Tragic 97.2% |
| Barbadians | 0.1 /100 | #281 | Tragic 97.2% |
| Afghans | 0.1 /100 | #282 | Tragic 97.1% |
| Houma | 0.1 /100 | #283 | Tragic 97.1% |
| Immigrants | Trinidad and Tobago | 0.0 /100 | #284 | Tragic 97.1% |
Demographics Similar to Immigrants from Bangladesh by 3rd Grade
In terms of 3rd grade, the demographic groups most similar to Immigrants from Bangladesh are Immigrants from Burma/Myanmar (96.6%, a difference of 0.020%), Hispanic or Latino (96.5%, a difference of 0.020%), Immigrants from the Azores (96.6%, a difference of 0.030%), Immigrants from Ecuador (96.6%, a difference of 0.040%), and Belizean (96.6%, a difference of 0.040%).
| Demographics | Rating | Rank | 3rd Grade |
| Cape Verdeans | 0.0 /100 | #310 | Tragic 96.6% |
| Immigrants | Guyana | 0.0 /100 | #311 | Tragic 96.6% |
| Immigrants | Laos | 0.0 /100 | #312 | Tragic 96.6% |
| Immigrants | Ecuador | 0.0 /100 | #313 | Tragic 96.6% |
| Belizeans | 0.0 /100 | #314 | Tragic 96.6% |
| Immigrants | Azores | 0.0 /100 | #315 | Tragic 96.6% |
| Immigrants | Burma/Myanmar | 0.0 /100 | #316 | Tragic 96.6% |
| Immigrants | Bangladesh | 0.0 /100 | #317 | Tragic 96.6% |
| Hispanics or Latinos | 0.0 /100 | #318 | Tragic 96.5% |
| Vietnamese | 0.0 /100 | #319 | Tragic 96.5% |
| Immigrants | Nicaragua | 0.0 /100 | #320 | Tragic 96.5% |
| Indonesians | 0.0 /100 | #321 | Tragic 96.5% |
| Immigrants | Belize | 0.0 /100 | #322 | Tragic 96.5% |
| Hondurans | 0.0 /100 | #323 | Tragic 96.5% |
| Dominicans | 0.0 /100 | #324 | Tragic 96.4% |