Tongan vs Immigrants from Netherlands 4th Grade

COMPARE

Tongan
Race
Ancestry
AfghanAfricanAlaska NativeAlaskan AthabascanAlbanianAleutAlsatianAmericanApacheArabArapahoArgentineanArmenianAssyrian/Chaldean/SyriacAustralianAustrianBahamianBangladeshiBarbadianBasqueBelgianBelizeanBermudanBhutaneseBlackfeetBolivianBrazilianBritishBritish West IndianBulgarianBurmeseCajunCambodianCanadianCape VerdeanCarpatho RusynCelticCentral AmericanCentral American IndianCherokeeCheyenneChickasawChileanChineseChippewaChoctawColombianColvilleComancheCosta RicanCreeCreekCroatianCrowCubanCypriotCzechCzechoslovakianDanishDelawareDominicanDutchDutch West IndianEastern EuropeanEcuadorianEgyptianEnglishEstonianEthiopianEuropeanFijianFilipinoFinnishFrenchFrench American IndianFrench CanadianGermanGerman RussianGhanaianGreekGuamanian/ChamorroGuatemalanGuyaneseHaitianHmongHonduranHopiHoumaHungarianIcelanderIndian (Asian)IndonesianInupiatIranianIraqiIrishIroquoisIsraeliItalianJamaicanJapaneseJordanianKenyanKiowaKoreanLaotianLatvianLebaneseLiberianLithuanianLumbeeLuxembourgerMacedonianMalaysianMalteseMarshalleseMenomineeMexicanMexican American IndianMongolianMoroccanNative HawaiianNavajoNepaleseNew ZealanderNicaraguanNigerianNorthern EuropeanNorwegianOkinawanOsageOttawaPaiutePakistaniPalestinianPanamanianParaguayanPennsylvania GermanPeruvianPimaPolishPortuguesePotawatomiPuebloPuerto RicanPuget Sound SalishRomanianRussianSalvadoranSamoanScandinavianScotch-IrishScottishSeminoleSenegaleseSerbianShoshoneSierra LeoneanSiouxSlavicSlovakSloveneSomaliSouth AfricanSouth AmericanSouth American IndianSoviet UnionSpaniardSpanishSpanish AmericanSpanish American IndianSri LankanSubsaharan AfricanSudaneseSwedishSwissSyrianTaiwaneseThaiTlingit-HaidaTohono O'OdhamTonganTrinidadian and TobagonianTsimshianTurkishU.S. Virgin IslanderUgandanUkrainianUruguayanUteVenezuelanVietnameseWelshWest IndianYakamaYaquiYugoslavianYumanYup'ikZimbabwean
Immigration
NonimmigrantsImmigrantsAfghanistanAfricaAlbaniaArgentinaArmeniaAsiaAustraliaAustriaBahamasBangladeshBarbadosBelarusBelgiumBelizeBoliviaBosnia and HerzegovinaBrazilBulgariaBurma/MyanmarCabo VerdeCambodiaCameroonCanadaCaribbeanCentral AmericaChileChinaColombiaCongoCosta RicaCroatiaCubaCzechoslovakiaDenmarkDominicaDominican RepublicEastern AfricaEastern AsiaEastern EuropeEcuadorEgyptEl SalvadorEnglandEritreaEthiopiaEuropeFijiFranceGermanyGhanaGreeceGrenadaGuatemalaGuyanaHaitiHondurasHong KongHungaryIndiaIndonesiaIranIraqIrelandIsraelItalyJamaicaJapanJordanKazakhstanKenyaKoreaKuwaitLaosLatin AmericaLatviaLebanonLiberiaLithuaniaMalaysiaMexicoMicronesiaMiddle AfricaMoldovaMoroccoNepalNicaraguaNigeriaNorth AmericaNorth MacedoniaNorthern AfricaNorthern EuropeNorwayOceaniaPakistanPanamaPeruPhilippinesPolandPortugalRomaniaRussiaSaudi ArabiaScotlandSenegalSerbiaSierra LeoneSingaporeSomaliaSouth AfricaSouth AmericaSouth Central AsiaSouth Eastern AsiaSouthern EuropeSpainSri LankaSt. Vincent and the GrenadinesSudanSwedenSwitzerlandSyriaTaiwanThailandTrinidad and TobagoTurkeyUgandaUkraineUruguayUzbekistanVenezuelaVietnamWest IndiesWestern AfricaWestern AsiaWestern EuropeYemenZaireZimbabweAzores
Immigrants from Netherlands
Race
Ancestry
AfghanAfricanAlaska NativeAlaskan AthabascanAlbanianAleutAlsatianAmericanApacheArabArapahoArgentineanArmenianAssyrian/Chaldean/SyriacAustralianAustrianBahamianBangladeshiBarbadianBasqueBelgianBelizeanBermudanBhutaneseBlackfeetBolivianBrazilianBritishBritish West IndianBulgarianBurmeseCajunCambodianCanadianCape VerdeanCarpatho RusynCelticCentral AmericanCentral American IndianCherokeeCheyenneChickasawChileanChineseChippewaChoctawColombianColvilleComancheCosta RicanCreeCreekCroatianCrowCubanCypriotCzechCzechoslovakianDanishDelawareDominicanDutchDutch West IndianEastern EuropeanEcuadorianEgyptianEnglishEstonianEthiopianEuropeanFijianFilipinoFinnishFrenchFrench American IndianFrench CanadianGermanGerman RussianGhanaianGreekGuamanian/ChamorroGuatemalanGuyaneseHaitianHmongHonduranHopiHoumaHungarianIcelanderIndian (Asian)IndonesianInupiatIranianIraqiIrishIroquoisIsraeliItalianJamaicanJapaneseJordanianKenyanKiowaKoreanLaotianLatvianLebaneseLiberianLithuanianLumbeeLuxembourgerMacedonianMalaysianMalteseMarshalleseMenomineeMexicanMexican American IndianMongolianMoroccanNative HawaiianNavajoNepaleseNew ZealanderNicaraguanNigerianNorthern EuropeanNorwegianOkinawanOsageOttawaPaiutePakistaniPalestinianPanamanianParaguayanPennsylvania GermanPeruvianPimaPolishPortuguesePotawatomiPuebloPuerto RicanPuget Sound SalishRomanianRussianSalvadoranSamoanScandinavianScotch-IrishScottishSeminoleSenegaleseSerbianShoshoneSierra LeoneanSiouxSlavicSlovakSloveneSomaliSouth AfricanSouth AmericanSouth American IndianSoviet UnionSpaniardSpanishSpanish AmericanSpanish American IndianSri LankanSubsaharan AfricanSudaneseSwedishSwissSyrianTaiwaneseThaiTlingit-HaidaTohono O'OdhamTrinidadian and TobagonianTsimshianTurkishU.S. Virgin IslanderUgandanUkrainianUruguayanUteVenezuelanVietnameseWelshWest IndianYakamaYaquiYugoslavianYumanYup'ikZimbabwean
Immigration
NonimmigrantsImmigrantsAfghanistanAfricaAlbaniaArgentinaArmeniaAsiaAustraliaAustriaBahamasBangladeshBarbadosBelarusBelgiumBelizeBoliviaBosnia and HerzegovinaBrazilBulgariaBurma/MyanmarCabo VerdeCambodiaCameroonCanadaCaribbeanCentral AmericaChileChinaColombiaCongoCosta RicaCroatiaCubaCzechoslovakiaDenmarkDominicaDominican RepublicEastern AfricaEastern AsiaEastern EuropeEcuadorEgyptEl SalvadorEnglandEritreaEthiopiaEuropeFijiFranceGermanyGhanaGreeceGrenadaGuatemalaGuyanaHaitiHondurasHong KongHungaryIndiaIndonesiaIranIraqIrelandIsraelItalyJamaicaJapanJordanKazakhstanKenyaKoreaKuwaitLaosLatin AmericaLatviaLebanonLiberiaLithuaniaMalaysiaMexicoMicronesiaMiddle AfricaMoldovaMoroccoNepalNetherlandsNicaraguaNigeriaNorth AmericaNorth MacedoniaNorthern AfricaNorthern EuropeNorwayOceaniaPakistanPanamaPeruPhilippinesPolandPortugalRomaniaRussiaSaudi ArabiaScotlandSenegalSerbiaSierra LeoneSingaporeSomaliaSouth AfricaSouth AmericaSouth Central AsiaSouth Eastern AsiaSouthern EuropeSpainSri LankaSt. Vincent and the GrenadinesSudanSwedenSwitzerlandSyriaTaiwanThailandTrinidad and TobagoTurkeyUgandaUkraineUruguayUzbekistanVenezuelaVietnamWest IndiesWestern AfricaWestern AsiaWestern EuropeYemenZaireZimbabweAzores
4th Grade
Income
Poverty
Unemployment
Labor Participation
Family Structure
Vehicle Availability
Education Level
Disability

4th Grade Comparison

Tongans

Immigrants from Netherlands

Tragic
Exceptional
97.3%
4TH GRADE
5.8/ 100
METRIC RATING
219th/ 347
METRIC RANK
98.0%
4TH GRADE
99.3/ 100
METRIC RATING
75th/ 347
METRIC RANK

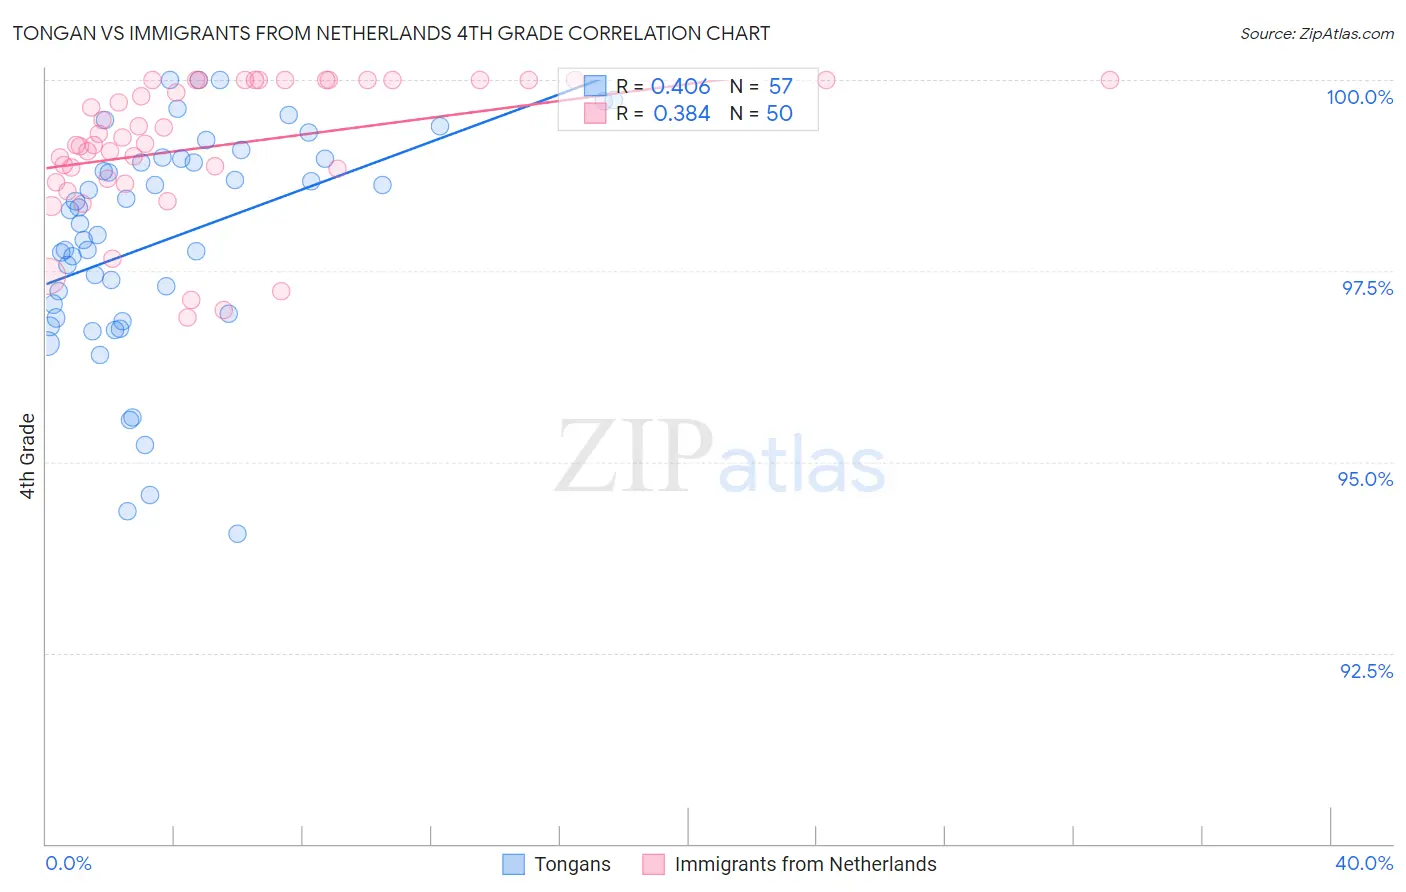
Tongan vs Immigrants from Netherlands 4th Grade Correlation Chart

The statistical analysis conducted on geographies consisting of 102,877,776 people shows a moderate positive correlation between the proportion of Tongans and percentage of population with at least 4th grade education in the United States with a correlation coefficient (R) of 0.406 and weighted average of 97.3%. Similarly, the statistical analysis conducted on geographies consisting of 237,869,934 people shows a mild positive correlation between the proportion of Immigrants from Netherlands and percentage of population with at least 4th grade education in the United States with a correlation coefficient (R) of 0.384 and weighted average of 98.0%, a difference of 0.74%.
Tongan vs Immigrants from Netherlands 4th Grade

4th Grade Correlation Summary

MeasurementTonganImmigrants from Netherlands
Minimum94.1%96.9%
Maximum100.0%100.0%
Range5.9%3.1%
Mean97.9%99.1%
Median98.1%99.2%
Interquartile 25% (IQ1)96.9%98.7%
Interquartile 75% (IQ3)99.0%100.0%
Interquartile Range (IQR)2.1%1.3%
Standard Deviation (Sample)1.4%0.90%
Standard Deviation (Population)1.4%0.89%

Similar Demographics by 4th Grade

Demographics Similar to Tongans by 4th Grade

In terms of 4th grade, the demographic groups most similar to Tongans are Sierra Leonean (97.3%, a difference of 0.010%), Iraqi (97.3%, a difference of 0.010%), South American Indian (97.3%, a difference of 0.010%), Immigrants from Panama (97.3%, a difference of 0.010%), and Immigrants from Lebanon (97.3%, a difference of 0.010%).
DemographicsRating | Rank4th Grade
Tohono O'odham
8.4
/100
|
#212
Tragic
97.3%
Costa Ricans
8.3
/100
|
#213
Tragic
97.3%
Immigrants | Nepal
7.7
/100
|
#214
Tragic
97.3%
Immigrants | Morocco
7.1
/100
|
#215
Tragic
97.3%
Samoans
6.8
/100
|
#216
Tragic
97.3%
Sierra Leoneans
6.5
/100
|
#217
Tragic
97.3%
Iraqis
6.3
/100
|
#218
Tragic
97.3%
Tongans
5.8
/100
|
#219
Tragic
97.3%
South American Indians
5.5
/100
|
#220
Tragic
97.3%
Immigrants | Panama
5.4
/100
|
#221
Tragic
97.3%
Immigrants | Lebanon
5.1
/100
|
#222
Tragic
97.3%
Immigrants | Sudan
5.0
/100
|
#223
Tragic
97.2%
Immigrants | Syria
5.0
/100
|
#224
Tragic
97.2%
Immigrants | Iraq
4.6
/100
|
#225
Tragic
97.2%
Bahamians
3.8
/100
|
#226
Tragic
97.2%

Demographics Similar to Immigrants from Netherlands by 4th Grade

In terms of 4th grade, the demographic groups most similar to Immigrants from Netherlands are Cherokee (98.0%, a difference of 0.0%), Immigrants from Lithuania (98.0%, a difference of 0.0%), Chickasaw (98.0%, a difference of 0.010%), Immigrants from England (98.0%, a difference of 0.010%), and Ukrainian (98.0%, a difference of 0.010%).
DemographicsRating | Rank4th Grade
Kiowa
99.6
/100
|
#68
Exceptional
98.0%
Pueblo
99.6
/100
|
#69
Exceptional
98.0%
Immigrants | Austria
99.6
/100
|
#70
Exceptional
98.0%
Lumbee
99.6
/100
|
#71
Exceptional
98.0%
Iranians
99.4
/100
|
#72
Exceptional
98.0%
Macedonians
99.4
/100
|
#73
Exceptional
98.0%
Chickasaw
99.4
/100
|
#74
Exceptional
98.0%
Immigrants | Netherlands
99.3
/100
|
#75
Exceptional
98.0%
Cherokee
99.3
/100
|
#76
Exceptional
98.0%
Immigrants | Lithuania
99.3
/100
|
#77
Exceptional
98.0%
Immigrants | England
99.3
/100
|
#78
Exceptional
98.0%
Ukrainians
99.2
/100
|
#79
Exceptional
98.0%
Osage
99.2
/100
|
#80
Exceptional
98.0%
Immigrants | India
99.1
/100
|
#81
Exceptional
98.0%
Icelanders
99.1
/100
|
#82
Exceptional
98.0%