Taiwanese vs Immigrants from Netherlands 4th Grade
COMPARE
Taiwanese
Immigrants from Netherlands
4th Grade
4th Grade Comparison
Taiwanese
Immigrants from Netherlands
97.0%
4TH GRADE
0.3/ 100
METRIC RATING
264th/ 347
METRIC RANK
98.0%
4TH GRADE
99.3/ 100
METRIC RATING
75th/ 347
METRIC RANK
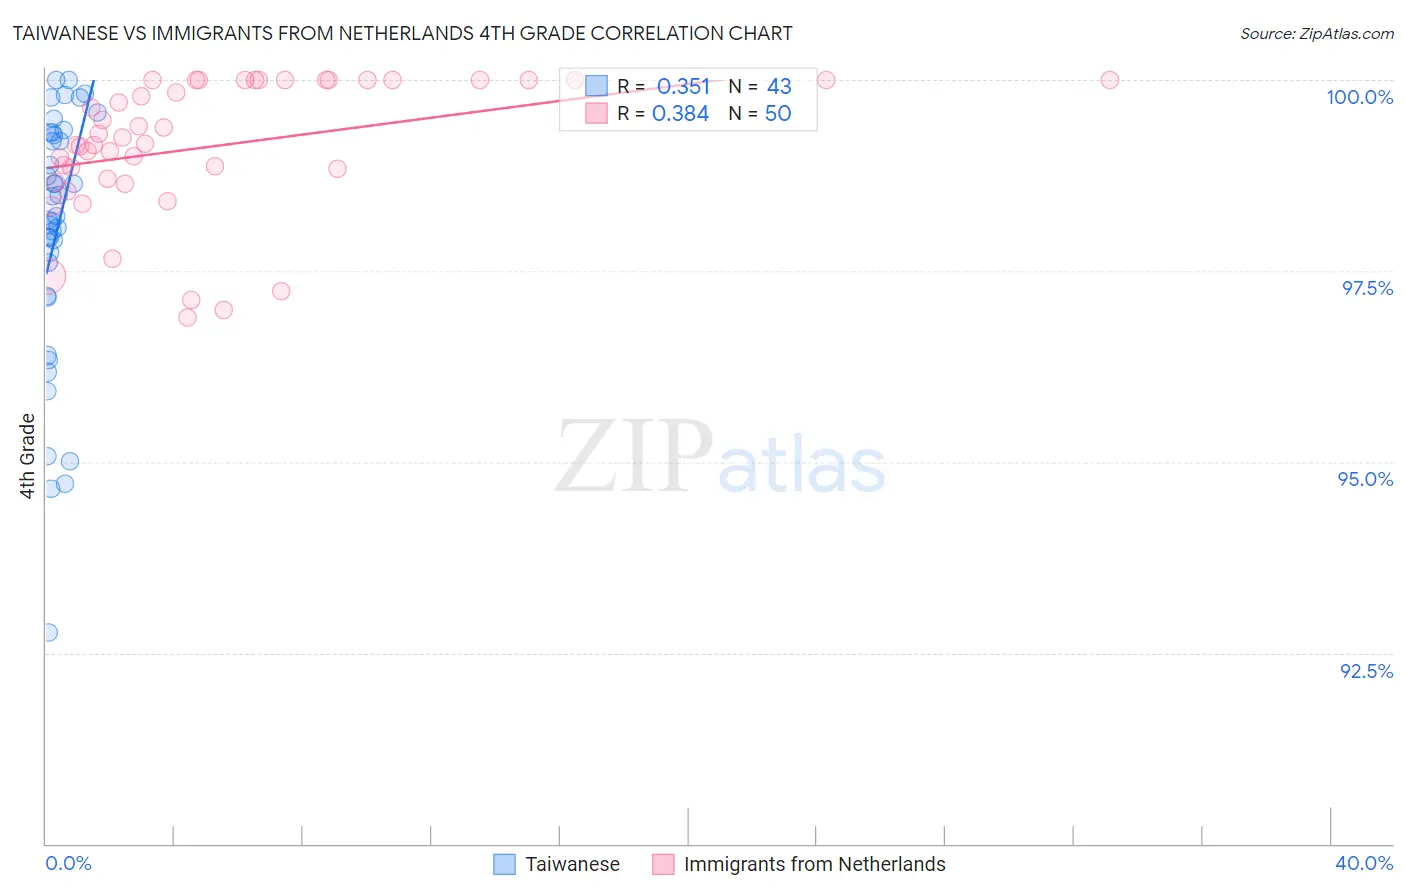
Taiwanese vs Immigrants from Netherlands 4th Grade Correlation Chart
The statistical analysis conducted on geographies consisting of 31,677,387 people shows a mild positive correlation between the proportion of Taiwanese and percentage of population with at least 4th grade education in the United States with a correlation coefficient (R) of 0.351 and weighted average of 97.0%. Similarly, the statistical analysis conducted on geographies consisting of 237,869,934 people shows a mild positive correlation between the proportion of Immigrants from Netherlands and percentage of population with at least 4th grade education in the United States with a correlation coefficient (R) of 0.384 and weighted average of 98.0%, a difference of 1.0%.
4th Grade Correlation Summary
| Measurement | Taiwanese | Immigrants from Netherlands |
| Minimum | 92.8% | 96.9% |
| Maximum | 100.0% | 100.0% |
| Range | 7.2% | 3.1% |
| Mean | 98.0% | 99.1% |
| Median | 98.2% | 99.2% |
| Interquartile 25% (IQ1) | 97.2% | 98.7% |
| Interquartile 75% (IQ3) | 99.3% | 100.0% |
| Interquartile Range (IQR) | 2.1% | 1.3% |
| Standard Deviation (Sample) | 1.7% | 0.90% |
| Standard Deviation (Population) | 1.7% | 0.89% |
Similar Demographics by 4th Grade
Demographics Similar to Taiwanese by 4th Grade
In terms of 4th grade, the demographic groups most similar to Taiwanese are Armenian (97.0%, a difference of 0.0%), West Indian (97.0%, a difference of 0.010%), Immigrants from Jamaica (97.0%, a difference of 0.010%), Immigrants from China (97.0%, a difference of 0.010%), and Immigrants from Nigeria (97.0%, a difference of 0.010%).
| Demographics | Rating | Rank | 4th Grade |
| Immigrants | Congo | 0.5 /100 | #257 | Tragic 97.0% |
| Immigrants | Colombia | 0.5 /100 | #258 | Tragic 97.0% |
| Immigrants | Ethiopia | 0.4 /100 | #259 | Tragic 97.0% |
| Immigrants | Sierra Leone | 0.4 /100 | #260 | Tragic 97.0% |
| Immigrants | South America | 0.4 /100 | #261 | Tragic 97.0% |
| West Indians | 0.4 /100 | #262 | Tragic 97.0% |
| Immigrants | Jamaica | 0.3 /100 | #263 | Tragic 97.0% |
| Taiwanese | 0.3 /100 | #264 | Tragic 97.0% |
| Armenians | 0.3 /100 | #265 | Tragic 97.0% |
| Immigrants | China | 0.3 /100 | #266 | Tragic 97.0% |
| Immigrants | Nigeria | 0.3 /100 | #267 | Tragic 97.0% |
| Ghanaians | 0.2 /100 | #268 | Tragic 97.0% |
| Immigrants | Uzbekistan | 0.2 /100 | #269 | Tragic 96.9% |
| Cubans | 0.2 /100 | #270 | Tragic 96.9% |
| Immigrants | Peru | 0.1 /100 | #271 | Tragic 96.9% |
Demographics Similar to Immigrants from Netherlands by 4th Grade
In terms of 4th grade, the demographic groups most similar to Immigrants from Netherlands are Cherokee (98.0%, a difference of 0.0%), Immigrants from Lithuania (98.0%, a difference of 0.0%), Chickasaw (98.0%, a difference of 0.010%), Immigrants from England (98.0%, a difference of 0.010%), and Ukrainian (98.0%, a difference of 0.010%).
| Demographics | Rating | Rank | 4th Grade |
| Kiowa | 99.6 /100 | #68 | Exceptional 98.0% |
| Pueblo | 99.6 /100 | #69 | Exceptional 98.0% |
| Immigrants | Austria | 99.6 /100 | #70 | Exceptional 98.0% |
| Lumbee | 99.6 /100 | #71 | Exceptional 98.0% |
| Iranians | 99.4 /100 | #72 | Exceptional 98.0% |
| Macedonians | 99.4 /100 | #73 | Exceptional 98.0% |
| Chickasaw | 99.4 /100 | #74 | Exceptional 98.0% |
| Immigrants | Netherlands | 99.3 /100 | #75 | Exceptional 98.0% |
| Cherokee | 99.3 /100 | #76 | Exceptional 98.0% |
| Immigrants | Lithuania | 99.3 /100 | #77 | Exceptional 98.0% |
| Immigrants | England | 99.3 /100 | #78 | Exceptional 98.0% |
| Ukrainians | 99.2 /100 | #79 | Exceptional 98.0% |
| Osage | 99.2 /100 | #80 | Exceptional 98.0% |
| Immigrants | India | 99.1 /100 | #81 | Exceptional 98.0% |
| Icelanders | 99.1 /100 | #82 | Exceptional 98.0% |