Tohono O'odham vs Luxembourger 1st Grade
COMPARE
Tohono O'odham
Luxembourger
1st Grade
1st Grade Comparison
Tohono O'odham
Luxembourgers
97.8%
1ST GRADE
23.2/ 100
METRIC RATING
199th/ 347
METRIC RANK
98.5%
1ST GRADE
99.9/ 100
METRIC RATING
40th/ 347
METRIC RANK
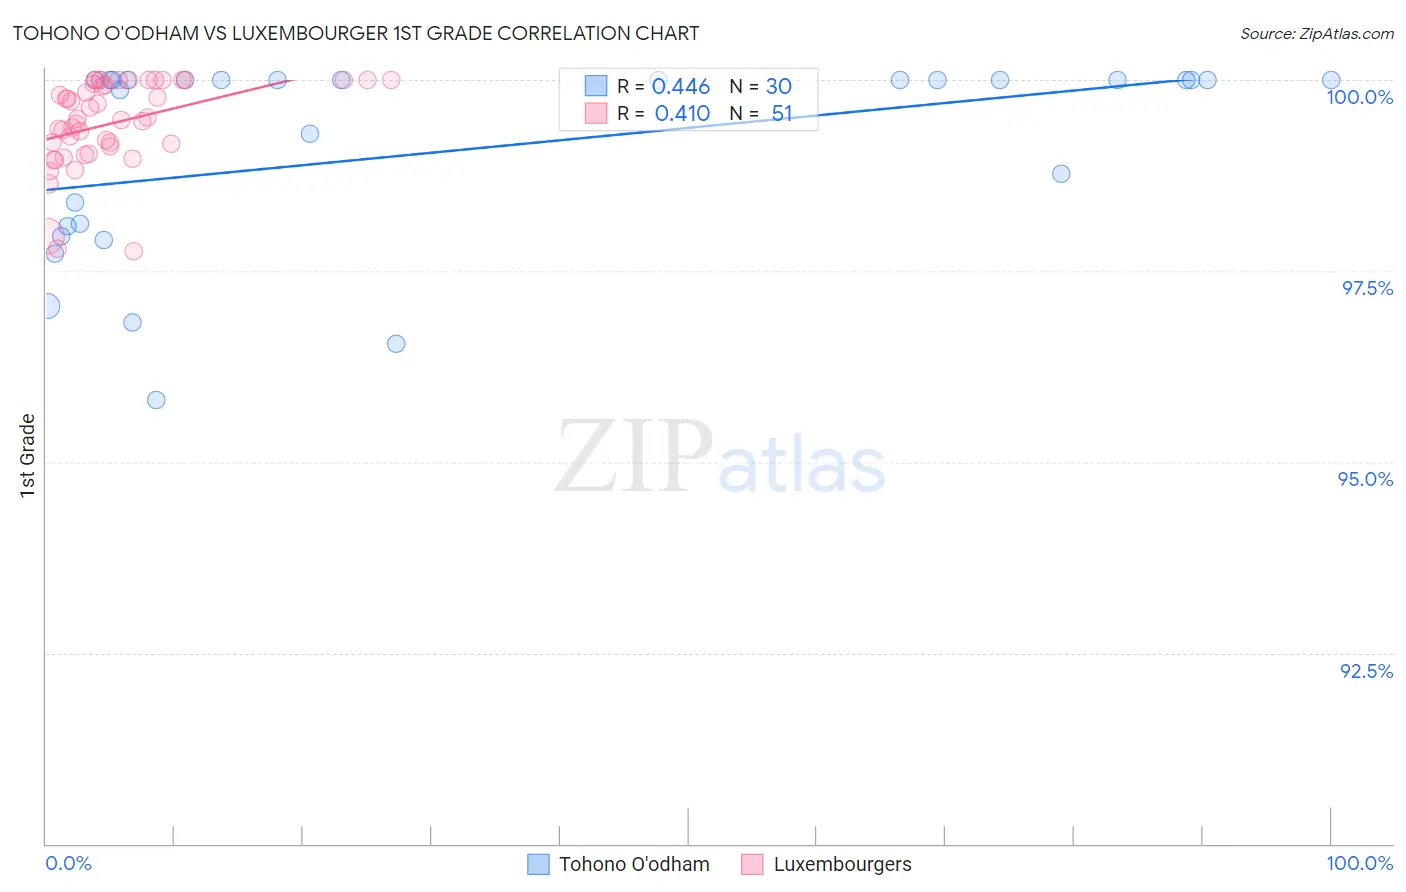
Tohono O'odham vs Luxembourger 1st Grade Correlation Chart
The statistical analysis conducted on geographies consisting of 58,723,100 people shows a moderate positive correlation between the proportion of Tohono O'odham and percentage of population with at least 1st grade education in the United States with a correlation coefficient (R) of 0.446 and weighted average of 97.8%. Similarly, the statistical analysis conducted on geographies consisting of 144,675,804 people shows a moderate positive correlation between the proportion of Luxembourgers and percentage of population with at least 1st grade education in the United States with a correlation coefficient (R) of 0.410 and weighted average of 98.5%, a difference of 0.65%.
1st Grade Correlation Summary
| Measurement | Tohono O'odham | Luxembourger |
| Minimum | 95.8% | 97.8% |
| Maximum | 100.0% | 100.0% |
| Range | 4.2% | 2.2% |
| Mean | 99.1% | 99.4% |
| Median | 100.0% | 99.5% |
| Interquartile 25% (IQ1) | 98.1% | 99.1% |
| Interquartile 75% (IQ3) | 100.0% | 100.0% |
| Interquartile Range (IQR) | 1.9% | 0.87% |
| Standard Deviation (Sample) | 1.3% | 0.57% |
| Standard Deviation (Population) | 1.3% | 0.57% |
Similar Demographics by 1st Grade
Demographics Similar to Tohono O'odham by 1st Grade
In terms of 1st grade, the demographic groups most similar to Tohono O'odham are Immigrants from Egypt (97.8%, a difference of 0.0%), Immigrants from Kenya (97.8%, a difference of 0.010%), Guamanian/Chamorro (97.8%, a difference of 0.010%), Yuman (97.8%, a difference of 0.010%), and Immigrants from Lebanon (97.8%, a difference of 0.010%).
| Demographics | Rating | Rank | 1st Grade |
| Paraguayans | 30.2 /100 | #192 | Fair 97.9% |
| Immigrants | Taiwan | 29.4 /100 | #193 | Fair 97.9% |
| Mongolians | 29.2 /100 | #194 | Fair 97.9% |
| Hawaiians | 28.8 /100 | #195 | Fair 97.9% |
| Immigrants | Kenya | 26.3 /100 | #196 | Fair 97.8% |
| Guamanians/Chamorros | 26.2 /100 | #197 | Fair 97.8% |
| Yuman | 24.4 /100 | #198 | Fair 97.8% |
| Tohono O'odham | 23.2 /100 | #199 | Fair 97.8% |
| Immigrants | Egypt | 22.6 /100 | #200 | Fair 97.8% |
| Immigrants | Lebanon | 20.1 /100 | #201 | Fair 97.8% |
| Immigrants | Ukraine | 19.2 /100 | #202 | Poor 97.8% |
| Immigrants | Southern Europe | 18.2 /100 | #203 | Poor 97.8% |
| Immigrants | Uganda | 18.2 /100 | #204 | Poor 97.8% |
| Immigrants | Chile | 17.7 /100 | #205 | Poor 97.8% |
| Immigrants | Albania | 17.3 /100 | #206 | Poor 97.8% |
Demographics Similar to Luxembourgers by 1st Grade
In terms of 1st grade, the demographic groups most similar to Luxembourgers are Eastern European (98.5%, a difference of 0.0%), Italian (98.5%, a difference of 0.010%), Chippewa (98.5%, a difference of 0.010%), Latvian (98.5%, a difference of 0.010%), and Native Hawaiian (98.5%, a difference of 0.010%).
| Demographics | Rating | Rank | 1st Grade |
| Scandinavians | 100.0 /100 | #33 | Exceptional 98.5% |
| Swiss | 100.0 /100 | #34 | Exceptional 98.5% |
| Chinese | 100.0 /100 | #35 | Exceptional 98.5% |
| British | 100.0 /100 | #36 | Exceptional 98.5% |
| Italians | 99.9 /100 | #37 | Exceptional 98.5% |
| Chippewa | 99.9 /100 | #38 | Exceptional 98.5% |
| Latvians | 99.9 /100 | #39 | Exceptional 98.5% |
| Luxembourgers | 99.9 /100 | #40 | Exceptional 98.5% |
| Eastern Europeans | 99.9 /100 | #41 | Exceptional 98.5% |
| Native Hawaiians | 99.9 /100 | #42 | Exceptional 98.5% |
| Lumbee | 99.9 /100 | #43 | Exceptional 98.5% |
| Northern Europeans | 99.9 /100 | #44 | Exceptional 98.5% |
| Belgians | 99.9 /100 | #45 | Exceptional 98.4% |
| Hungarians | 99.9 /100 | #46 | Exceptional 98.4% |
| Ottawa | 99.8 /100 | #47 | Exceptional 98.4% |