Thai vs Hispanic or Latino Associate's Degree
COMPARE
Thai
Hispanic or Latino
Associate's Degree
Associate's Degree Comparison
Thais
Hispanics or Latinos
57.4%
ASSOCIATE'S DEGREE
100.0/ 100
METRIC RATING
8th/ 347
METRIC RANK
37.7%
ASSOCIATE'S DEGREE
0.0/ 100
METRIC RATING
313th/ 347
METRIC RANK
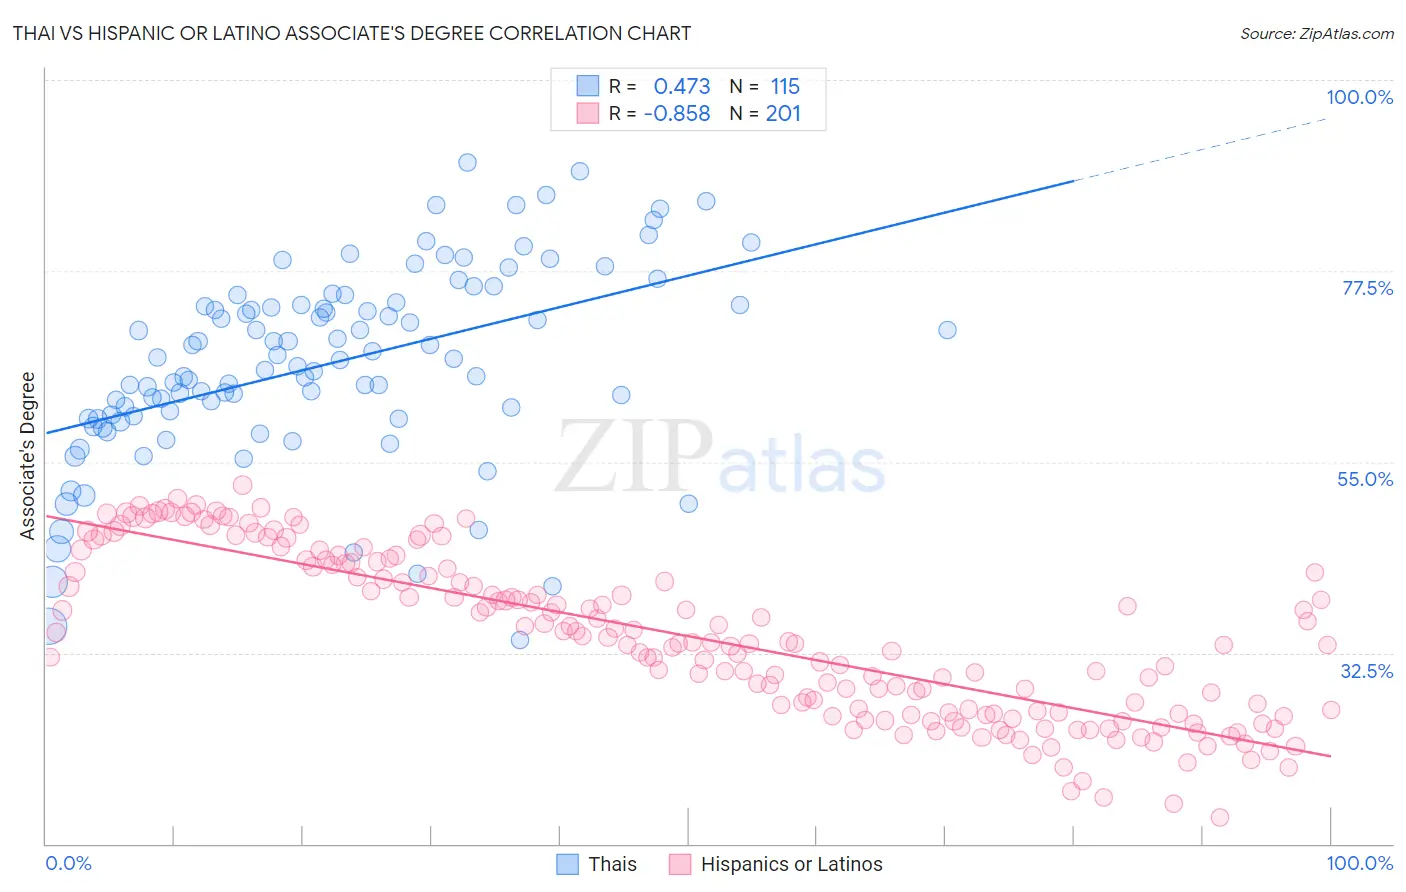
Thai vs Hispanic or Latino Associate's Degree Correlation Chart
The statistical analysis conducted on geographies consisting of 475,760,266 people shows a moderate positive correlation between the proportion of Thais and percentage of population with at least associate's degree education in the United States with a correlation coefficient (R) of 0.473 and weighted average of 57.4%. Similarly, the statistical analysis conducted on geographies consisting of 578,463,109 people shows a very strong negative correlation between the proportion of Hispanics or Latinos and percentage of population with at least associate's degree education in the United States with a correlation coefficient (R) of -0.858 and weighted average of 37.7%, a difference of 52.2%.
Associate's Degree Correlation Summary
| Measurement | Thai | Hispanic or Latino |
| Minimum | 34.0% | 13.1% |
| Maximum | 90.2% | 52.2% |
| Range | 56.3% | 39.2% |
| Mean | 66.5% | 34.4% |
| Median | 66.9% | 33.7% |
| Interquartile 25% (IQ1) | 60.1% | 25.5% |
| Interquartile 75% (IQ3) | 73.5% | 42.9% |
| Interquartile Range (IQR) | 13.3% | 17.5% |
| Standard Deviation (Sample) | 11.4% | 9.6% |
| Standard Deviation (Population) | 11.4% | 9.6% |
Similar Demographics by Associate's Degree
Demographics Similar to Thais by Associate's Degree
In terms of associate's degree, the demographic groups most similar to Thais are Immigrants from Iran (57.7%, a difference of 0.40%), Okinawan (57.7%, a difference of 0.46%), Immigrants from Israel (56.8%, a difference of 1.1%), Iranian (58.2%, a difference of 1.3%), and Immigrants from Taiwan (58.4%, a difference of 1.7%).
| Demographics | Rating | Rank | Associate's Degree |
| Filipinos | 100.0 /100 | #1 | Exceptional 59.8% |
| Immigrants | Singapore | 100.0 /100 | #2 | Exceptional 58.9% |
| Immigrants | India | 100.0 /100 | #3 | Exceptional 58.5% |
| Immigrants | Taiwan | 100.0 /100 | #4 | Exceptional 58.4% |
| Iranians | 100.0 /100 | #5 | Exceptional 58.2% |
| Okinawans | 100.0 /100 | #6 | Exceptional 57.7% |
| Immigrants | Iran | 100.0 /100 | #7 | Exceptional 57.7% |
| Thais | 100.0 /100 | #8 | Exceptional 57.4% |
| Immigrants | Israel | 100.0 /100 | #9 | Exceptional 56.8% |
| Cypriots | 100.0 /100 | #10 | Exceptional 56.4% |
| Immigrants | Australia | 100.0 /100 | #11 | Exceptional 55.8% |
| Immigrants | South Central Asia | 100.0 /100 | #12 | Exceptional 55.7% |
| Immigrants | China | 100.0 /100 | #13 | Exceptional 55.5% |
| Immigrants | Hong Kong | 100.0 /100 | #14 | Exceptional 55.4% |
| Immigrants | Eastern Asia | 100.0 /100 | #15 | Exceptional 55.4% |
Demographics Similar to Hispanics or Latinos by Associate's Degree
In terms of associate's degree, the demographic groups most similar to Hispanics or Latinos are Seminole (37.7%, a difference of 0.050%), Choctaw (37.8%, a difference of 0.15%), Immigrants from Latin America (37.9%, a difference of 0.37%), Creek (37.6%, a difference of 0.44%), and Crow (37.6%, a difference of 0.45%).
| Demographics | Rating | Rank | Associate's Degree |
| Shoshone | 0.0 /100 | #306 | Tragic 38.4% |
| Immigrants | El Salvador | 0.0 /100 | #307 | Tragic 38.4% |
| Mexican American Indians | 0.0 /100 | #308 | Tragic 38.2% |
| Immigrants | Guatemala | 0.0 /100 | #309 | Tragic 38.1% |
| Immigrants | Dominican Republic | 0.0 /100 | #310 | Tragic 37.9% |
| Immigrants | Latin America | 0.0 /100 | #311 | Tragic 37.9% |
| Choctaw | 0.0 /100 | #312 | Tragic 37.8% |
| Hispanics or Latinos | 0.0 /100 | #313 | Tragic 37.7% |
| Seminole | 0.0 /100 | #314 | Tragic 37.7% |
| Creek | 0.0 /100 | #315 | Tragic 37.6% |
| Crow | 0.0 /100 | #316 | Tragic 37.6% |
| Yaqui | 0.0 /100 | #317 | Tragic 37.6% |
| Alaska Natives | 0.0 /100 | #318 | Tragic 37.5% |
| Fijians | 0.0 /100 | #319 | Tragic 37.4% |
| Cajuns | 0.0 /100 | #320 | Tragic 37.4% |