Taiwanese vs Immigrants from Australia Professional Degree
COMPARE
Taiwanese
Immigrants from Australia
Professional Degree
Professional Degree Comparison
Taiwanese
Immigrants from Australia
5.0%
PROFESSIONAL DEGREE
97.3/ 100
METRIC RATING
112th/ 347
METRIC RANK
6.9%
PROFESSIONAL DEGREE
100.0/ 100
METRIC RATING
13th/ 347
METRIC RANK
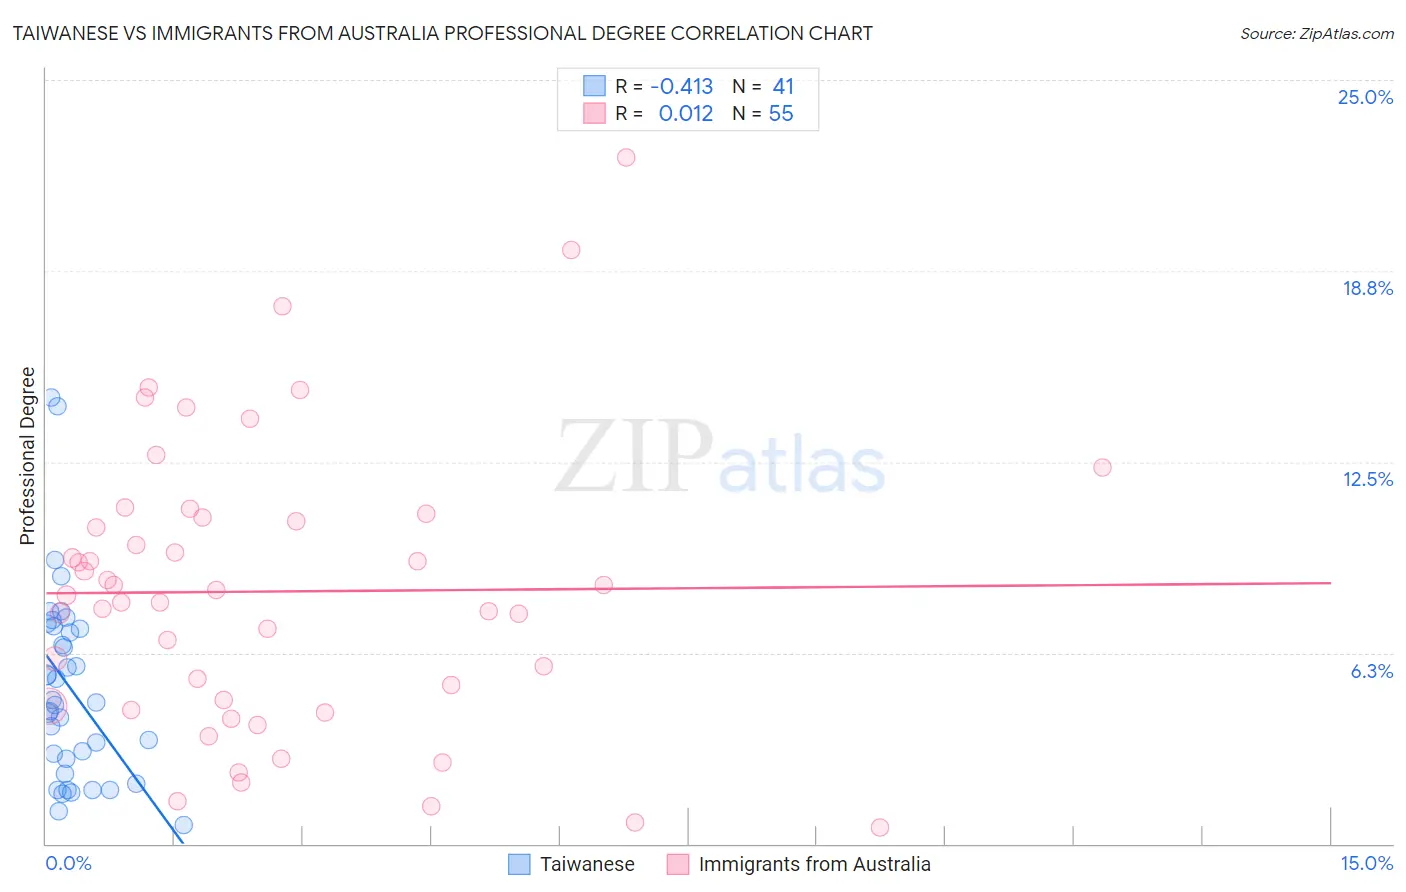
Taiwanese vs Immigrants from Australia Professional Degree Correlation Chart
The statistical analysis conducted on geographies consisting of 31,716,094 people shows a moderate negative correlation between the proportion of Taiwanese and percentage of population with at least professional degree education in the United States with a correlation coefficient (R) of -0.413 and weighted average of 5.0%. Similarly, the statistical analysis conducted on geographies consisting of 227,049,899 people shows no correlation between the proportion of Immigrants from Australia and percentage of population with at least professional degree education in the United States with a correlation coefficient (R) of 0.012 and weighted average of 6.9%, a difference of 38.7%.
Professional Degree Correlation Summary
| Measurement | Taiwanese | Immigrants from Australia |
| Minimum | 0.61% | 0.53% |
| Maximum | 14.6% | 22.5% |
| Range | 14.0% | 21.9% |
| Mean | 5.1% | 8.3% |
| Median | 4.6% | 8.1% |
| Interquartile 25% (IQ1) | 2.5% | 4.5% |
| Interquartile 75% (IQ3) | 7.1% | 10.7% |
| Interquartile Range (IQR) | 4.6% | 6.2% |
| Standard Deviation (Sample) | 3.2% | 4.7% |
| Standard Deviation (Population) | 3.1% | 4.7% |
Similar Demographics by Professional Degree
Demographics Similar to Taiwanese by Professional Degree
In terms of professional degree, the demographic groups most similar to Taiwanese are Immigrants from Pakistan (5.0%, a difference of 0.020%), Brazilian (5.0%, a difference of 0.22%), Immigrants from Morocco (5.0%, a difference of 0.47%), Moroccan (5.0%, a difference of 0.57%), and Lebanese (5.0%, a difference of 0.96%).
| Demographics | Rating | Rank | Professional Degree |
| Immigrants | Uganda | 98.2 /100 | #105 | Exceptional 5.0% |
| Immigrants | Ukraine | 98.2 /100 | #106 | Exceptional 5.0% |
| Maltese | 98.1 /100 | #107 | Exceptional 5.0% |
| Immigrants | Southern Europe | 98.1 /100 | #108 | Exceptional 5.0% |
| British | 98.0 /100 | #109 | Exceptional 5.0% |
| Lebanese | 98.0 /100 | #110 | Exceptional 5.0% |
| Brazilians | 97.4 /100 | #111 | Exceptional 5.0% |
| Taiwanese | 97.3 /100 | #112 | Exceptional 5.0% |
| Immigrants | Pakistan | 97.2 /100 | #113 | Exceptional 5.0% |
| Immigrants | Morocco | 96.8 /100 | #114 | Exceptional 5.0% |
| Moroccans | 96.8 /100 | #115 | Exceptional 5.0% |
| Venezuelans | 96.3 /100 | #116 | Exceptional 4.9% |
| Immigrants | Syria | 96.0 /100 | #117 | Exceptional 4.9% |
| Croatians | 96.0 /100 | #118 | Exceptional 4.9% |
| Immigrants | Sudan | 95.4 /100 | #119 | Exceptional 4.9% |
Demographics Similar to Immigrants from Australia by Professional Degree
In terms of professional degree, the demographic groups most similar to Immigrants from Australia are Israeli (6.9%, a difference of 0.43%), Cypriot (6.9%, a difference of 0.49%), Immigrants from Belgium (7.0%, a difference of 0.66%), Immigrants from France (6.8%, a difference of 1.5%), and Immigrants from Taiwan (7.1%, a difference of 2.4%).
| Demographics | Rating | Rank | Professional Degree |
| Okinawans | 100.0 /100 | #6 | Exceptional 7.3% |
| Eastern Europeans | 100.0 /100 | #7 | Exceptional 7.1% |
| Immigrants | Switzerland | 100.0 /100 | #8 | Exceptional 7.1% |
| Immigrants | Taiwan | 100.0 /100 | #9 | Exceptional 7.1% |
| Immigrants | Belgium | 100.0 /100 | #10 | Exceptional 7.0% |
| Cypriots | 100.0 /100 | #11 | Exceptional 6.9% |
| Israelis | 100.0 /100 | #12 | Exceptional 6.9% |
| Immigrants | Australia | 100.0 /100 | #13 | Exceptional 6.9% |
| Immigrants | France | 100.0 /100 | #14 | Exceptional 6.8% |
| Immigrants | China | 100.0 /100 | #15 | Exceptional 6.7% |
| Immigrants | Sweden | 100.0 /100 | #16 | Exceptional 6.7% |
| Immigrants | Eastern Asia | 100.0 /100 | #17 | Exceptional 6.6% |
| Soviet Union | 100.0 /100 | #18 | Exceptional 6.6% |
| Indians (Asian) | 100.0 /100 | #19 | Exceptional 6.5% |
| Immigrants | Denmark | 100.0 /100 | #20 | Exceptional 6.4% |