Syrian vs Basque 7th Grade
COMPARE
Syrian
Basque
7th Grade
7th Grade Comparison
Syrians
Basques
96.5%
7TH GRADE
96.6/ 100
METRIC RATING
116th/ 347
METRIC RANK
96.4%
7TH GRADE
89.3/ 100
METRIC RATING
139th/ 347
METRIC RANK
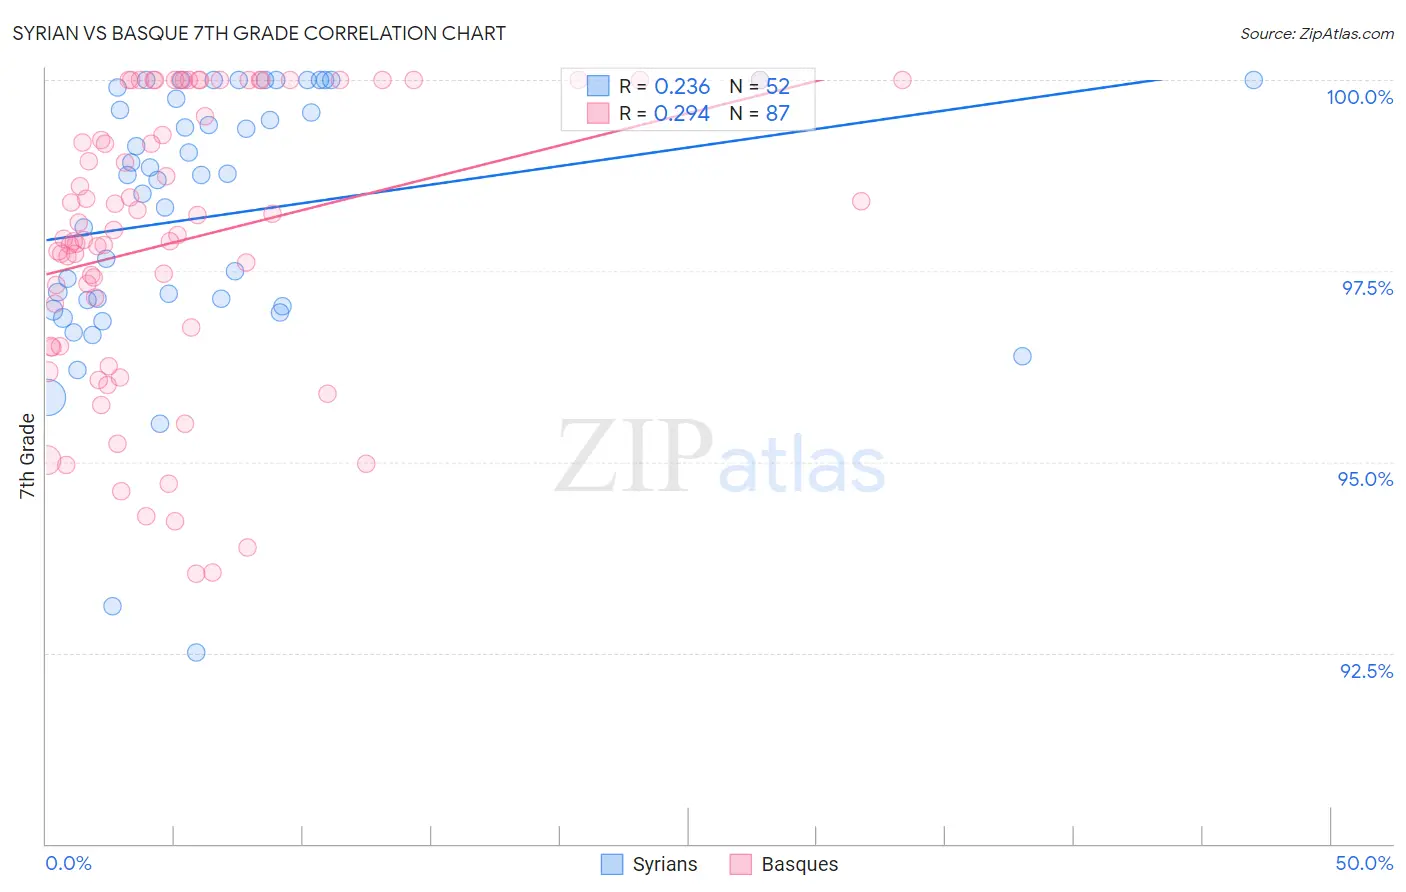
Syrian vs Basque 7th Grade Correlation Chart
The statistical analysis conducted on geographies consisting of 266,305,988 people shows a weak positive correlation between the proportion of Syrians and percentage of population with at least 7th grade education in the United States with a correlation coefficient (R) of 0.236 and weighted average of 96.5%. Similarly, the statistical analysis conducted on geographies consisting of 165,777,136 people shows a weak positive correlation between the proportion of Basques and percentage of population with at least 7th grade education in the United States with a correlation coefficient (R) of 0.294 and weighted average of 96.4%, a difference of 0.19%.
7th Grade Correlation Summary
| Measurement | Syrian | Basque |
| Minimum | 92.5% | 93.5% |
| Maximum | 100.0% | 100.0% |
| Range | 7.5% | 6.5% |
| Mean | 98.2% | 97.9% |
| Median | 98.8% | 98.0% |
| Interquartile 25% (IQ1) | 97.1% | 96.5% |
| Interquartile 75% (IQ3) | 99.8% | 100.0% |
| Interquartile Range (IQR) | 2.7% | 3.5% |
| Standard Deviation (Sample) | 1.7% | 1.8% |
| Standard Deviation (Population) | 1.7% | 1.8% |
Similar Demographics by 7th Grade
Demographics Similar to Syrians by 7th Grade
In terms of 7th grade, the demographic groups most similar to Syrians are Immigrants from Zimbabwe (96.5%, a difference of 0.0%), Choctaw (96.5%, a difference of 0.0%), Pueblo (96.5%, a difference of 0.010%), Nonimmigrants (96.5%, a difference of 0.020%), and Okinawan (96.6%, a difference of 0.040%).
| Demographics | Rating | Rank | 7th Grade |
| Bhutanese | 97.7 /100 | #109 | Exceptional 96.6% |
| Okinawans | 97.4 /100 | #110 | Exceptional 96.6% |
| Immigrants | Latvia | 97.4 /100 | #111 | Exceptional 96.6% |
| Immigrants | Nonimmigrants | 97.0 /100 | #112 | Exceptional 96.5% |
| Pueblo | 96.8 /100 | #113 | Exceptional 96.5% |
| Immigrants | Zimbabwe | 96.6 /100 | #114 | Exceptional 96.5% |
| Choctaw | 96.6 /100 | #115 | Exceptional 96.5% |
| Syrians | 96.6 /100 | #116 | Exceptional 96.5% |
| Immigrants | Moldova | 95.7 /100 | #117 | Exceptional 96.5% |
| Immigrants | Japan | 95.5 /100 | #118 | Exceptional 96.5% |
| Immigrants | Norway | 95.2 /100 | #119 | Exceptional 96.5% |
| Immigrants | Croatia | 95.0 /100 | #120 | Exceptional 96.5% |
| Cheyenne | 94.9 /100 | #121 | Exceptional 96.5% |
| Immigrants | Europe | 94.8 /100 | #122 | Exceptional 96.5% |
| Immigrants | France | 94.7 /100 | #123 | Exceptional 96.5% |
Demographics Similar to Basques by 7th Grade
In terms of 7th grade, the demographic groups most similar to Basques are Jordanian (96.4%, a difference of 0.010%), Immigrants from Hungary (96.4%, a difference of 0.020%), Immigrants from Turkey (96.4%, a difference of 0.020%), Cambodian (96.3%, a difference of 0.020%), and Soviet Union (96.4%, a difference of 0.030%).
| Demographics | Rating | Rank | 7th Grade |
| Colville | 91.7 /100 | #132 | Exceptional 96.4% |
| Hmong | 91.5 /100 | #133 | Exceptional 96.4% |
| Soviet Union | 91.2 /100 | #134 | Exceptional 96.4% |
| Immigrants | Kuwait | 91.1 /100 | #135 | Exceptional 96.4% |
| Immigrants | Hungary | 90.6 /100 | #136 | Exceptional 96.4% |
| Immigrants | Turkey | 90.2 /100 | #137 | Exceptional 96.4% |
| Jordanians | 90.0 /100 | #138 | Excellent 96.4% |
| Basques | 89.3 /100 | #139 | Excellent 96.4% |
| Cambodians | 88.3 /100 | #140 | Excellent 96.3% |
| Immigrants | South Central Asia | 87.1 /100 | #141 | Excellent 96.3% |
| Burmese | 87.1 /100 | #142 | Excellent 96.3% |
| Spanish | 86.6 /100 | #143 | Excellent 96.3% |
| Immigrants | Greece | 85.9 /100 | #144 | Excellent 96.3% |
| Blackfeet | 83.9 /100 | #145 | Excellent 96.3% |
| Immigrants | Eastern Europe | 83.7 /100 | #146 | Excellent 96.3% |