French vs Samoan 11th Grade
COMPARE
French
Samoan
11th Grade
11th Grade Comparison
French
Samoans
94.1%
11TH GRADE
99.9/ 100
METRIC RATING
50th/ 347
METRIC RANK
92.3%
11TH GRADE
25.1/ 100
METRIC RATING
200th/ 347
METRIC RANK
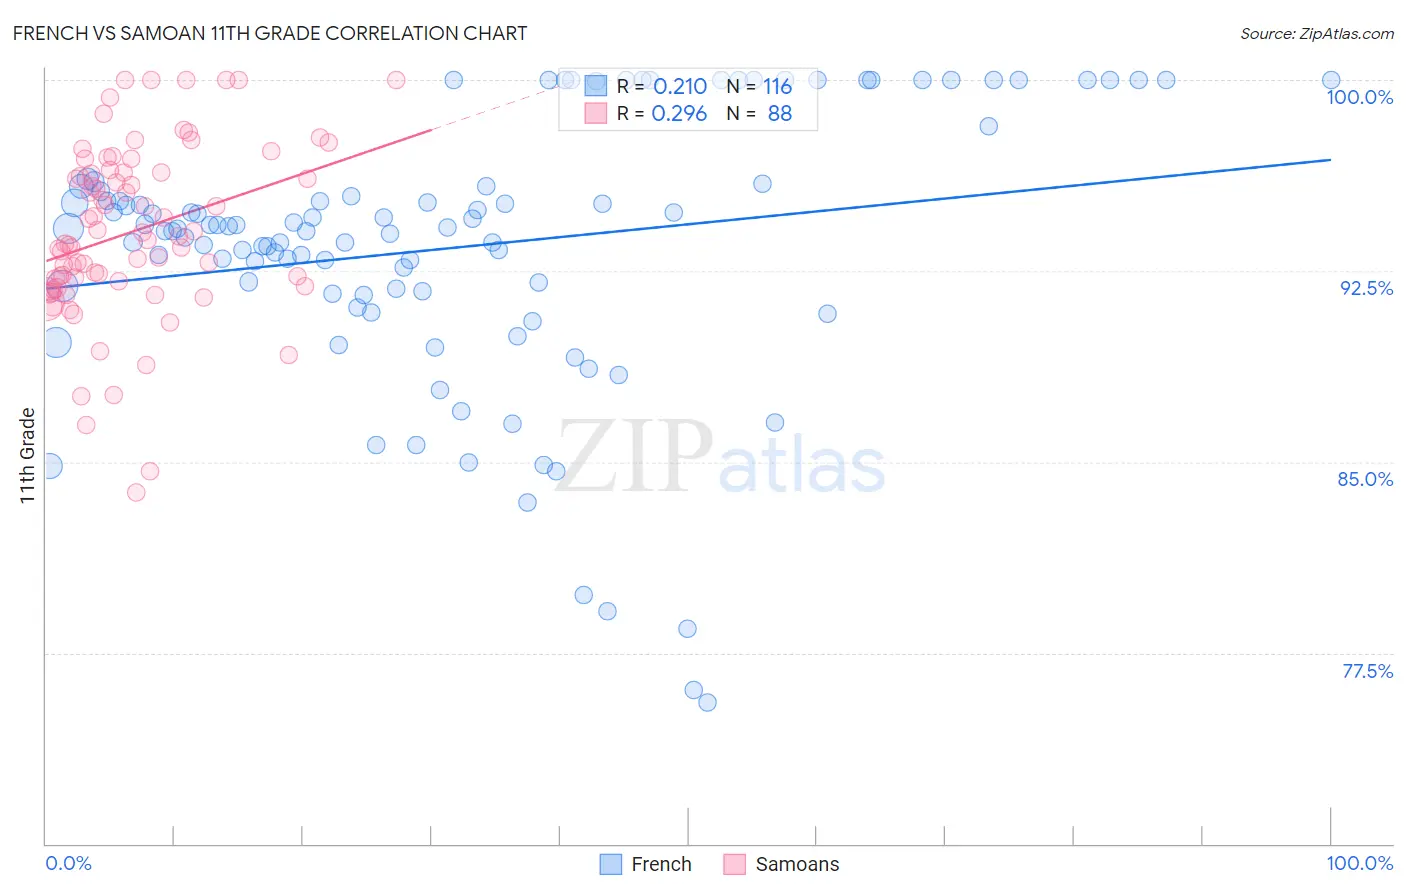
French vs Samoan 11th Grade Correlation Chart
The statistical analysis conducted on geographies consisting of 572,427,471 people shows a weak positive correlation between the proportion of French and percentage of population with at least 11th grade education in the United States with a correlation coefficient (R) of 0.210 and weighted average of 94.1%. Similarly, the statistical analysis conducted on geographies consisting of 225,205,818 people shows a weak positive correlation between the proportion of Samoans and percentage of population with at least 11th grade education in the United States with a correlation coefficient (R) of 0.296 and weighted average of 92.3%, a difference of 1.9%.
11th Grade Correlation Summary
| Measurement | French | Samoan |
| Minimum | 75.6% | 83.8% |
| Maximum | 100.0% | 100.0% |
| Range | 24.4% | 16.2% |
| Mean | 93.4% | 94.0% |
| Median | 94.2% | 93.8% |
| Interquartile 25% (IQ1) | 91.7% | 92.0% |
| Interquartile 75% (IQ3) | 95.8% | 96.4% |
| Interquartile Range (IQR) | 4.1% | 4.4% |
| Standard Deviation (Sample) | 5.3% | 3.4% |
| Standard Deviation (Population) | 5.3% | 3.4% |
Similar Demographics by 11th Grade
Demographics Similar to French by 11th Grade
In terms of 11th grade, the demographic groups most similar to French are Macedonian (94.1%, a difference of 0.0%), Slavic (94.1%, a difference of 0.0%), Filipino (94.1%, a difference of 0.010%), Serbian (94.1%, a difference of 0.020%), and Australian (94.1%, a difference of 0.030%).
| Demographics | Rating | Rank | 11th Grade |
| Greeks | 99.9 /100 | #43 | Exceptional 94.1% |
| Immigrants | Ireland | 99.9 /100 | #44 | Exceptional 94.1% |
| Australians | 99.9 /100 | #45 | Exceptional 94.1% |
| Serbians | 99.9 /100 | #46 | Exceptional 94.1% |
| Filipinos | 99.9 /100 | #47 | Exceptional 94.1% |
| Macedonians | 99.9 /100 | #48 | Exceptional 94.1% |
| Slavs | 99.9 /100 | #49 | Exceptional 94.1% |
| French | 99.9 /100 | #50 | Exceptional 94.1% |
| Turks | 99.9 /100 | #51 | Exceptional 94.0% |
| Immigrants | Canada | 99.9 /100 | #52 | Exceptional 94.0% |
| Immigrants | Australia | 99.9 /100 | #53 | Exceptional 94.0% |
| Immigrants | North America | 99.9 /100 | #54 | Exceptional 94.0% |
| Czechoslovakians | 99.9 /100 | #55 | Exceptional 94.0% |
| French Canadians | 99.9 /100 | #56 | Exceptional 94.0% |
| New Zealanders | 99.9 /100 | #57 | Exceptional 94.0% |
Demographics Similar to Samoans by 11th Grade
In terms of 11th grade, the demographic groups most similar to Samoans are Immigrants from Uganda (92.3%, a difference of 0.0%), Immigrants from China (92.3%, a difference of 0.0%), Marshallese (92.3%, a difference of 0.010%), Hawaiian (92.3%, a difference of 0.010%), and Immigrants from Eastern Africa (92.3%, a difference of 0.010%).
| Demographics | Rating | Rank | 11th Grade |
| Moroccans | 28.7 /100 | #193 | Fair 92.3% |
| Sioux | 28.5 /100 | #194 | Fair 92.3% |
| Liberians | 26.8 /100 | #195 | Fair 92.3% |
| Panamanians | 26.4 /100 | #196 | Fair 92.3% |
| Marshallese | 26.0 /100 | #197 | Fair 92.3% |
| Hawaiians | 25.5 /100 | #198 | Fair 92.3% |
| Immigrants | Uganda | 25.2 /100 | #199 | Fair 92.3% |
| Samoans | 25.1 /100 | #200 | Fair 92.3% |
| Immigrants | China | 25.1 /100 | #201 | Fair 92.3% |
| Immigrants | Eastern Africa | 24.1 /100 | #202 | Fair 92.3% |
| Immigrants | Sudan | 23.5 /100 | #203 | Fair 92.3% |
| Immigrants | Hong Kong | 23.3 /100 | #204 | Fair 92.2% |
| Kiowa | 23.2 /100 | #205 | Fair 92.2% |
| Bolivians | 23.2 /100 | #206 | Fair 92.2% |
| Immigrants | Oceania | 22.4 /100 | #207 | Fair 92.2% |