Syrian vs Arapaho 10th Grade
COMPARE
Syrian
Arapaho
10th Grade
10th Grade Comparison
Syrians
Arapaho
94.5%
10TH GRADE
97.7/ 100
METRIC RATING
101st/ 347
METRIC RANK
94.2%
10TH GRADE
90.5/ 100
METRIC RATING
137th/ 347
METRIC RANK
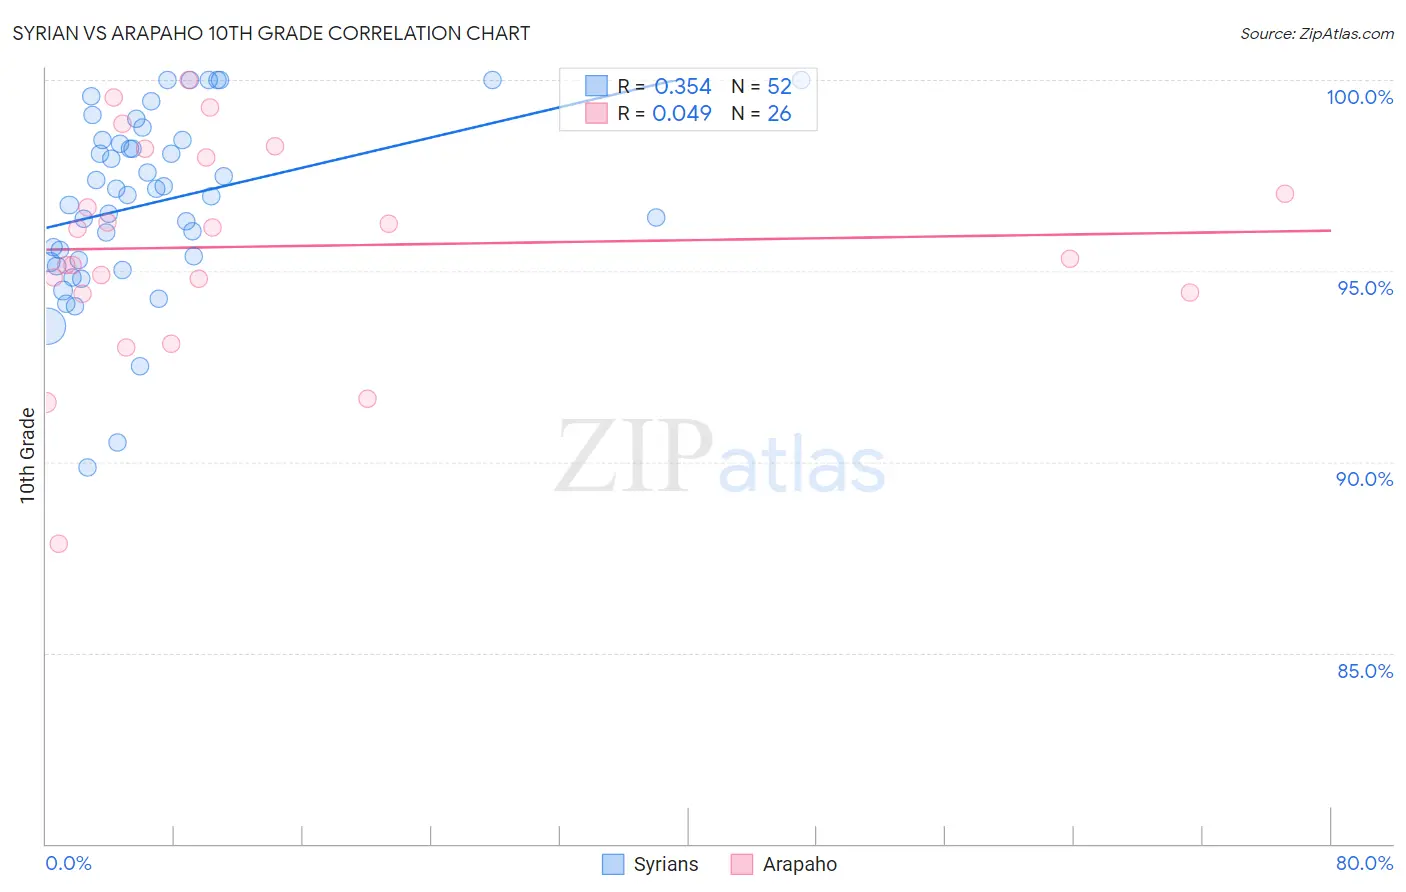
Syrian vs Arapaho 10th Grade Correlation Chart
The statistical analysis conducted on geographies consisting of 266,305,988 people shows a mild positive correlation between the proportion of Syrians and percentage of population with at least 10th grade education in the United States with a correlation coefficient (R) of 0.354 and weighted average of 94.5%. Similarly, the statistical analysis conducted on geographies consisting of 29,780,040 people shows no correlation between the proportion of Arapaho and percentage of population with at least 10th grade education in the United States with a correlation coefficient (R) of 0.049 and weighted average of 94.2%, a difference of 0.33%.
10th Grade Correlation Summary
| Measurement | Syrian | Arapaho |
| Minimum | 89.8% | 87.9% |
| Maximum | 100.0% | 100.0% |
| Range | 10.2% | 12.1% |
| Mean | 96.8% | 95.6% |
| Median | 97.1% | 95.7% |
| Interquartile 25% (IQ1) | 95.3% | 94.4% |
| Interquartile 75% (IQ3) | 98.4% | 98.0% |
| Interquartile Range (IQR) | 3.2% | 3.6% |
| Standard Deviation (Sample) | 2.4% | 2.8% |
| Standard Deviation (Population) | 2.3% | 2.7% |
Similar Demographics by 10th Grade
Demographics Similar to Syrians by 10th Grade
In terms of 10th grade, the demographic groups most similar to Syrians are Immigrants from South Central Asia (94.5%, a difference of 0.0%), Cambodian (94.5%, a difference of 0.010%), Immigrants from France (94.5%, a difference of 0.020%), Immigrants from Europe (94.5%, a difference of 0.020%), and Immigrants from Romania (94.5%, a difference of 0.020%).
| Demographics | Rating | Rank | 10th Grade |
| Immigrants | Germany | 98.3 /100 | #94 | Exceptional 94.6% |
| Menominee | 98.3 /100 | #95 | Exceptional 94.6% |
| Immigrants | Switzerland | 98.3 /100 | #96 | Exceptional 94.6% |
| Lebanese | 98.3 /100 | #97 | Exceptional 94.6% |
| Immigrants | Bulgaria | 98.1 /100 | #98 | Exceptional 94.6% |
| Immigrants | France | 97.9 /100 | #99 | Exceptional 94.5% |
| Immigrants | South Central Asia | 97.8 /100 | #100 | Exceptional 94.5% |
| Syrians | 97.7 /100 | #101 | Exceptional 94.5% |
| Cambodians | 97.6 /100 | #102 | Exceptional 94.5% |
| Immigrants | Europe | 97.5 /100 | #103 | Exceptional 94.5% |
| Immigrants | Romania | 97.5 /100 | #104 | Exceptional 94.5% |
| Immigrants | Turkey | 97.4 /100 | #105 | Exceptional 94.5% |
| Immigrants | Serbia | 97.4 /100 | #106 | Exceptional 94.5% |
| Immigrants | Croatia | 97.4 /100 | #107 | Exceptional 94.5% |
| Immigrants | North Macedonia | 97.2 /100 | #108 | Exceptional 94.5% |
Demographics Similar to Arapaho by 10th Grade
In terms of 10th grade, the demographic groups most similar to Arapaho are Shoshone (94.2%, a difference of 0.010%), Immigrants from Sri Lanka (94.2%, a difference of 0.010%), Immigrants from Korea (94.2%, a difference of 0.020%), Osage (94.2%, a difference of 0.030%), and Immigrants from Bosnia and Herzegovina (94.2%, a difference of 0.030%).
| Demographics | Rating | Rank | 10th Grade |
| Immigrants | Greece | 92.7 /100 | #130 | Exceptional 94.3% |
| Immigrants | Eastern Europe | 92.5 /100 | #131 | Exceptional 94.3% |
| Immigrants | Russia | 92.4 /100 | #132 | Exceptional 94.3% |
| Creek | 91.9 /100 | #133 | Exceptional 94.2% |
| Osage | 91.7 /100 | #134 | Exceptional 94.2% |
| Immigrants | Korea | 91.3 /100 | #135 | Exceptional 94.2% |
| Shoshone | 90.8 /100 | #136 | Exceptional 94.2% |
| Arapaho | 90.5 /100 | #137 | Exceptional 94.2% |
| Immigrants | Sri Lanka | 89.9 /100 | #138 | Excellent 94.2% |
| Immigrants | Bosnia and Herzegovina | 89.4 /100 | #139 | Excellent 94.2% |
| Immigrants | Jordan | 87.6 /100 | #140 | Excellent 94.1% |
| Hmong | 86.6 /100 | #141 | Excellent 94.1% |
| Albanians | 86.5 /100 | #142 | Excellent 94.1% |
| Cherokee | 84.9 /100 | #143 | Excellent 94.1% |
| Immigrants | Kazakhstan | 84.9 /100 | #144 | Excellent 94.1% |