Swiss vs Swedish 2nd Grade
COMPARE
Swiss
Swedish
2nd Grade
2nd Grade Comparison
Swiss
Swedes
98.5%
2ND GRADE
100.0/ 100
METRIC RATING
35th/ 347
METRIC RANK
98.6%
2ND GRADE
100.0/ 100
METRIC RATING
14th/ 347
METRIC RANK
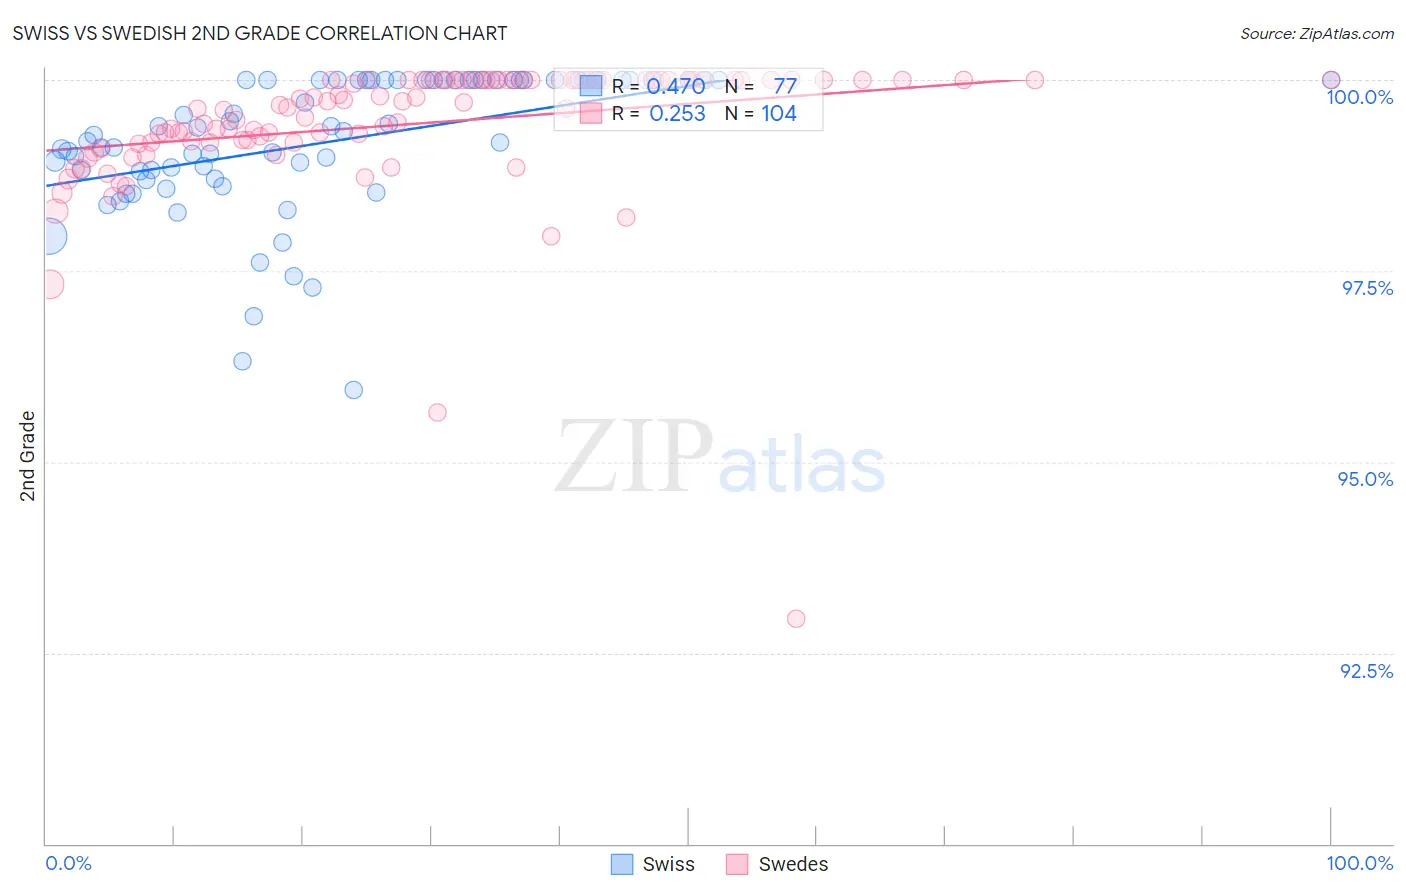
Swiss vs Swedish 2nd Grade Correlation Chart
The statistical analysis conducted on geographies consisting of 465,023,158 people shows a moderate positive correlation between the proportion of Swiss and percentage of population with at least 2nd grade education in the United States with a correlation coefficient (R) of 0.470 and weighted average of 98.5%. Similarly, the statistical analysis conducted on geographies consisting of 539,231,492 people shows a weak positive correlation between the proportion of Swedes and percentage of population with at least 2nd grade education in the United States with a correlation coefficient (R) of 0.253 and weighted average of 98.6%, a difference of 0.13%.
2nd Grade Correlation Summary
| Measurement | Swiss | Swedish |
| Minimum | 95.9% | 92.9% |
| Maximum | 100.0% | 100.0% |
| Range | 4.1% | 7.1% |
| Mean | 99.2% | 99.4% |
| Median | 99.3% | 99.7% |
| Interquartile 25% (IQ1) | 98.8% | 99.2% |
| Interquartile 75% (IQ3) | 100.0% | 100.0% |
| Interquartile Range (IQR) | 1.2% | 0.81% |
| Standard Deviation (Sample) | 0.91% | 0.93% |
| Standard Deviation (Population) | 0.91% | 0.92% |
Similar Demographics by 2nd Grade
Demographics Similar to Swiss by 2nd Grade
In terms of 2nd grade, the demographic groups most similar to Swiss are Chinese (98.5%, a difference of 0.010%), British (98.5%, a difference of 0.020%), European (98.5%, a difference of 0.030%), Czech (98.5%, a difference of 0.030%), and French Canadian (98.5%, a difference of 0.030%).
| Demographics | Rating | Rank | 2nd Grade |
| Arapaho | 100.0 /100 | #28 | Exceptional 98.5% |
| French | 100.0 /100 | #29 | Exceptional 98.5% |
| Europeans | 100.0 /100 | #30 | Exceptional 98.5% |
| Czechs | 100.0 /100 | #31 | Exceptional 98.5% |
| French Canadians | 100.0 /100 | #32 | Exceptional 98.5% |
| Scandinavians | 100.0 /100 | #33 | Exceptional 98.5% |
| Chinese | 100.0 /100 | #34 | Exceptional 98.5% |
| Swiss | 100.0 /100 | #35 | Exceptional 98.5% |
| British | 100.0 /100 | #36 | Exceptional 98.5% |
| Italians | 99.9 /100 | #37 | Exceptional 98.4% |
| Latvians | 99.9 /100 | #38 | Exceptional 98.4% |
| Chippewa | 99.9 /100 | #39 | Exceptional 98.4% |
| Luxembourgers | 99.9 /100 | #40 | Exceptional 98.4% |
| Eastern Europeans | 99.9 /100 | #41 | Exceptional 98.4% |
| Native Hawaiians | 99.9 /100 | #42 | Exceptional 98.4% |
Demographics Similar to Swedes by 2nd Grade
In terms of 2nd grade, the demographic groups most similar to Swedes are English (98.6%, a difference of 0.010%), Tlingit-Haida (98.6%, a difference of 0.020%), Carpatho Rusyn (98.6%, a difference of 0.020%), Scottish (98.6%, a difference of 0.020%), and Dutch (98.6%, a difference of 0.020%).
| Demographics | Rating | Rank | 2nd Grade |
| Norwegians | 100.0 /100 | #7 | Exceptional 98.7% |
| Germans | 100.0 /100 | #8 | Exceptional 98.7% |
| Slovaks | 100.0 /100 | #9 | Exceptional 98.7% |
| Slovenes | 100.0 /100 | #10 | Exceptional 98.6% |
| Tlingit-Haida | 100.0 /100 | #11 | Exceptional 98.6% |
| Carpatho Rusyns | 100.0 /100 | #12 | Exceptional 98.6% |
| English | 100.0 /100 | #13 | Exceptional 98.6% |
| Swedes | 100.0 /100 | #14 | Exceptional 98.6% |
| Scottish | 100.0 /100 | #15 | Exceptional 98.6% |
| Dutch | 100.0 /100 | #16 | Exceptional 98.6% |
| Aleuts | 100.0 /100 | #17 | Exceptional 98.6% |
| Irish | 100.0 /100 | #18 | Exceptional 98.6% |
| Finns | 100.0 /100 | #19 | Exceptional 98.5% |
| Sioux | 100.0 /100 | #20 | Exceptional 98.5% |
| Lithuanians | 100.0 /100 | #21 | Exceptional 98.5% |