Romanian vs Immigrants from Brazil 2nd Grade
COMPARE
Romanian
Immigrants from Brazil
2nd Grade
2nd Grade Comparison
Romanians
Immigrants from Brazil
98.2%
2ND GRADE
98.0/ 100
METRIC RATING
100th/ 347
METRIC RANK
97.9%
2ND GRADE
46.6/ 100
METRIC RATING
177th/ 347
METRIC RANK
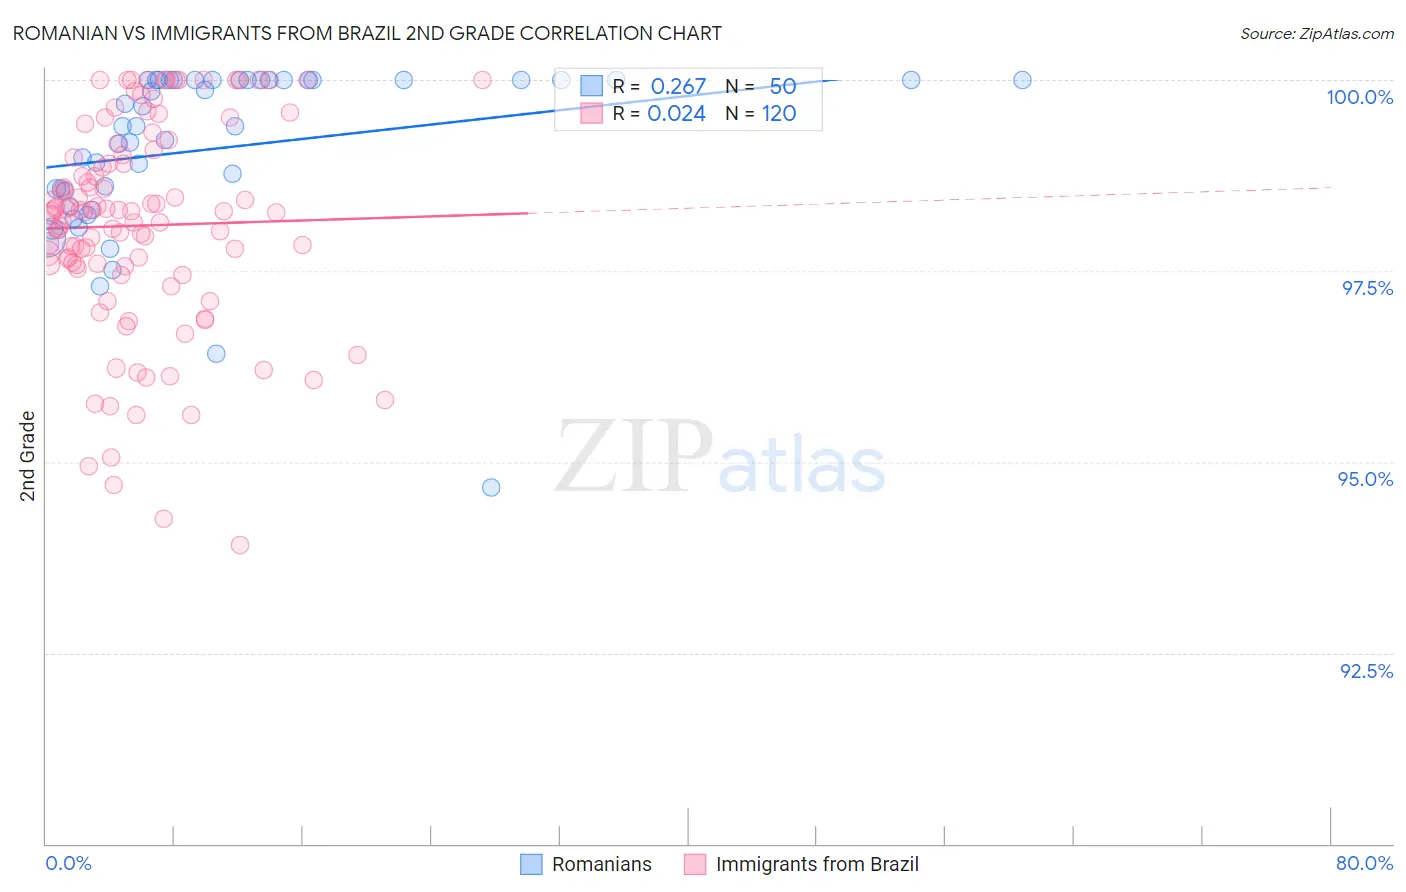
Romanian vs Immigrants from Brazil 2nd Grade Correlation Chart
The statistical analysis conducted on geographies consisting of 377,904,438 people shows a weak positive correlation between the proportion of Romanians and percentage of population with at least 2nd grade education in the United States with a correlation coefficient (R) of 0.267 and weighted average of 98.2%. Similarly, the statistical analysis conducted on geographies consisting of 343,021,580 people shows no correlation between the proportion of Immigrants from Brazil and percentage of population with at least 2nd grade education in the United States with a correlation coefficient (R) of 0.024 and weighted average of 97.9%, a difference of 0.32%.
2nd Grade Correlation Summary
| Measurement | Romanian | Immigrants from Brazil |
| Minimum | 94.7% | 93.9% |
| Maximum | 100.0% | 100.0% |
| Range | 5.3% | 6.1% |
| Mean | 99.1% | 98.1% |
| Median | 99.4% | 98.3% |
| Interquartile 25% (IQ1) | 98.5% | 97.6% |
| Interquartile 75% (IQ3) | 100.0% | 99.0% |
| Interquartile Range (IQR) | 1.5% | 1.4% |
| Standard Deviation (Sample) | 1.1% | 1.4% |
| Standard Deviation (Population) | 1.1% | 1.4% |
Similar Demographics by 2nd Grade
Demographics Similar to Romanians by 2nd Grade
In terms of 2nd grade, the demographic groups most similar to Romanians are Immigrants from Ireland (98.2%, a difference of 0.0%), Puget Sound Salish (98.2%, a difference of 0.0%), Cree (98.2%, a difference of 0.0%), Choctaw (98.2%, a difference of 0.010%), and Nonimmigrants (98.2%, a difference of 0.010%).
| Demographics | Rating | Rank | 2nd Grade |
| Immigrants | India | 98.8 /100 | #93 | Exceptional 98.2% |
| Immigrants | Germany | 98.6 /100 | #94 | Exceptional 98.2% |
| South Africans | 98.6 /100 | #95 | Exceptional 98.2% |
| Cypriots | 98.4 /100 | #96 | Exceptional 98.2% |
| Choctaw | 98.3 /100 | #97 | Exceptional 98.2% |
| Immigrants | Nonimmigrants | 98.3 /100 | #98 | Exceptional 98.2% |
| Immigrants | Ireland | 98.0 /100 | #99 | Exceptional 98.2% |
| Romanians | 98.0 /100 | #100 | Exceptional 98.2% |
| Puget Sound Salish | 98.0 /100 | #101 | Exceptional 98.2% |
| Cree | 98.0 /100 | #102 | Exceptional 98.2% |
| Pima | 97.6 /100 | #103 | Exceptional 98.2% |
| Turks | 97.6 /100 | #104 | Exceptional 98.2% |
| Yugoslavians | 97.5 /100 | #105 | Exceptional 98.2% |
| Bhutanese | 97.5 /100 | #106 | Exceptional 98.1% |
| German Russians | 97.4 /100 | #107 | Exceptional 98.1% |
Demographics Similar to Immigrants from Brazil by 2nd Grade
In terms of 2nd grade, the demographic groups most similar to Immigrants from Brazil are Argentinean (97.9%, a difference of 0.0%), Immigrants from Venezuela (97.9%, a difference of 0.0%), Immigrants from Micronesia (97.9%, a difference of 0.010%), Immigrants from Bosnia and Herzegovina (97.9%, a difference of 0.010%), and Immigrants from Sri Lanka (97.9%, a difference of 0.010%).
| Demographics | Rating | Rank | 2nd Grade |
| Navajo | 54.3 /100 | #170 | Average 97.9% |
| Albanians | 52.8 /100 | #171 | Average 97.9% |
| Immigrants | Korea | 52.7 /100 | #172 | Average 97.9% |
| Kenyans | 52.7 /100 | #173 | Average 97.9% |
| Immigrants | Micronesia | 50.0 /100 | #174 | Average 97.9% |
| Immigrants | Bosnia and Herzegovina | 49.8 /100 | #175 | Average 97.9% |
| Immigrants | Sri Lanka | 48.7 /100 | #176 | Average 97.9% |
| Immigrants | Brazil | 46.6 /100 | #177 | Average 97.9% |
| Argentineans | 46.3 /100 | #178 | Average 97.9% |
| Immigrants | Venezuela | 46.1 /100 | #179 | Average 97.9% |
| Natives/Alaskans | 44.3 /100 | #180 | Average 97.9% |
| Egyptians | 44.3 /100 | #181 | Average 97.9% |
| Portuguese | 42.4 /100 | #182 | Average 97.8% |
| Immigrants | Poland | 42.2 /100 | #183 | Average 97.8% |
| Immigrants | Belarus | 41.5 /100 | #184 | Average 97.8% |