Hmong vs Slavic 8th Grade
COMPARE
Hmong
Slavic
8th Grade
8th Grade Comparison
Hmong
Slavs
96.1%
8TH GRADE
89.7/ 100
METRIC RATING
139th/ 347
METRIC RANK
96.8%
8TH GRADE
99.9/ 100
METRIC RATING
48th/ 347
METRIC RANK
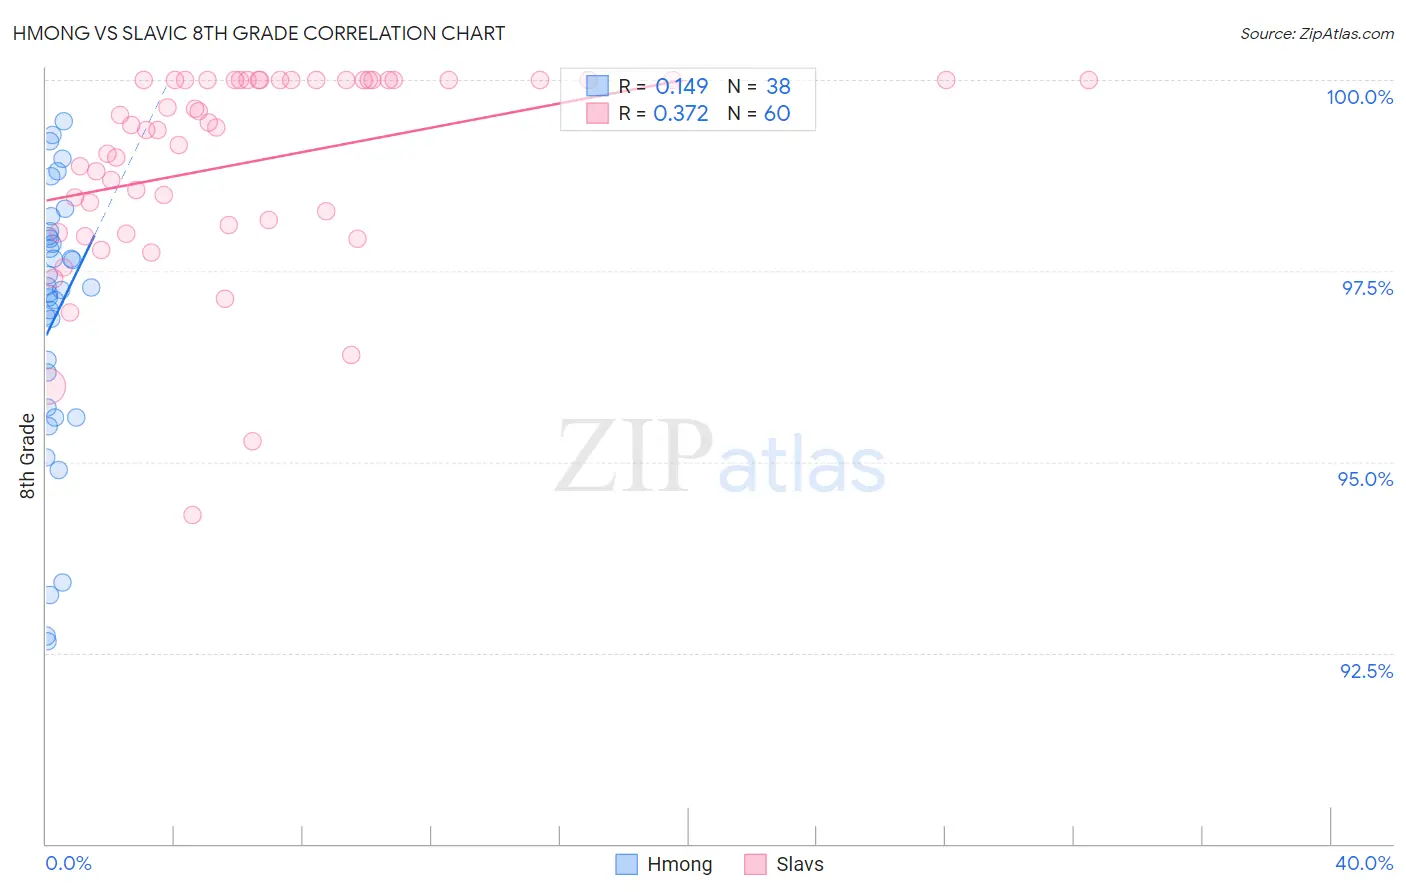
Hmong vs Slavic 8th Grade Correlation Chart
The statistical analysis conducted on geographies consisting of 24,672,093 people shows a poor positive correlation between the proportion of Hmong and percentage of population with at least 8th grade education in the United States with a correlation coefficient (R) of 0.149 and weighted average of 96.1%. Similarly, the statistical analysis conducted on geographies consisting of 270,869,056 people shows a mild positive correlation between the proportion of Slavs and percentage of population with at least 8th grade education in the United States with a correlation coefficient (R) of 0.372 and weighted average of 96.8%, a difference of 0.78%.
8th Grade Correlation Summary
| Measurement | Hmong | Slavic |
| Minimum | 92.7% | 94.3% |
| Maximum | 99.5% | 100.0% |
| Range | 6.8% | 5.7% |
| Mean | 96.9% | 98.9% |
| Median | 97.3% | 99.4% |
| Interquartile 25% (IQ1) | 95.7% | 98.1% |
| Interquartile 75% (IQ3) | 98.0% | 100.0% |
| Interquartile Range (IQR) | 2.2% | 1.9% |
| Standard Deviation (Sample) | 1.8% | 1.3% |
| Standard Deviation (Population) | 1.8% | 1.3% |
Similar Demographics by 8th Grade
Demographics Similar to Hmong by 8th Grade
In terms of 8th grade, the demographic groups most similar to Hmong are Burmese (96.1%, a difference of 0.010%), Immigrants from South Central Asia (96.1%, a difference of 0.010%), Cambodian (96.1%, a difference of 0.020%), Immigrants from Hungary (96.1%, a difference of 0.030%), and Basque (96.1%, a difference of 0.030%).
| Demographics | Rating | Rank | 8th Grade |
| Immigrants | Kuwait | 92.2 /100 | #132 | Exceptional 96.1% |
| Immigrants | Turkey | 91.7 /100 | #133 | Exceptional 96.1% |
| Immigrants | Hungary | 91.5 /100 | #134 | Exceptional 96.1% |
| Basques | 91.5 /100 | #135 | Exceptional 96.1% |
| Jordanians | 91.3 /100 | #136 | Exceptional 96.1% |
| Cambodians | 90.6 /100 | #137 | Exceptional 96.1% |
| Burmese | 90.2 /100 | #138 | Exceptional 96.1% |
| Hmong | 89.7 /100 | #139 | Excellent 96.1% |
| Immigrants | South Central Asia | 89.4 /100 | #140 | Excellent 96.1% |
| Immigrants | Greece | 85.9 /100 | #141 | Excellent 96.0% |
| Immigrants | Eastern Europe | 85.4 /100 | #142 | Excellent 96.0% |
| Spanish | 85.1 /100 | #143 | Excellent 96.0% |
| Immigrants | Belarus | 84.8 /100 | #144 | Excellent 96.0% |
| Lumbee | 84.1 /100 | #145 | Excellent 96.0% |
| Israelis | 84.1 /100 | #146 | Excellent 96.0% |
Demographics Similar to Slavs by 8th Grade
In terms of 8th grade, the demographic groups most similar to Slavs are Estonian (96.8%, a difference of 0.010%), Immigrants from Scotland (96.8%, a difference of 0.020%), Bulgarian (96.9%, a difference of 0.030%), Celtic (96.8%, a difference of 0.030%), and Czechoslovakian (96.9%, a difference of 0.040%).
| Demographics | Rating | Rank | 8th Grade |
| Eastern Europeans | 100.0 /100 | #41 | Exceptional 97.0% |
| Chinese | 100.0 /100 | #42 | Exceptional 96.9% |
| Aleuts | 99.9 /100 | #43 | Exceptional 96.9% |
| Maltese | 99.9 /100 | #44 | Exceptional 96.9% |
| Northern Europeans | 99.9 /100 | #45 | Exceptional 96.9% |
| Czechoslovakians | 99.9 /100 | #46 | Exceptional 96.9% |
| Bulgarians | 99.9 /100 | #47 | Exceptional 96.9% |
| Slavs | 99.9 /100 | #48 | Exceptional 96.8% |
| Estonians | 99.9 /100 | #49 | Exceptional 96.8% |
| Immigrants | Scotland | 99.9 /100 | #50 | Exceptional 96.8% |
| Celtics | 99.9 /100 | #51 | Exceptional 96.8% |
| Greeks | 99.9 /100 | #52 | Exceptional 96.8% |
| Austrians | 99.9 /100 | #53 | Exceptional 96.7% |
| Serbians | 99.8 /100 | #54 | Exceptional 96.7% |
| Russians | 99.8 /100 | #55 | Exceptional 96.7% |