Immigrants from Sri Lanka vs Navajo GED/Equivalency
COMPARE
Immigrants from Sri Lanka
Navajo
GED/Equivalency
GED/Equivalency Comparison
Immigrants from Sri Lanka
Navajo
87.5%
GED/EQUIVALENCY
98.3/ 100
METRIC RATING
81st/ 347
METRIC RANK
81.5%
GED/EQUIVALENCY
0.0/ 100
METRIC RATING
304th/ 347
METRIC RANK
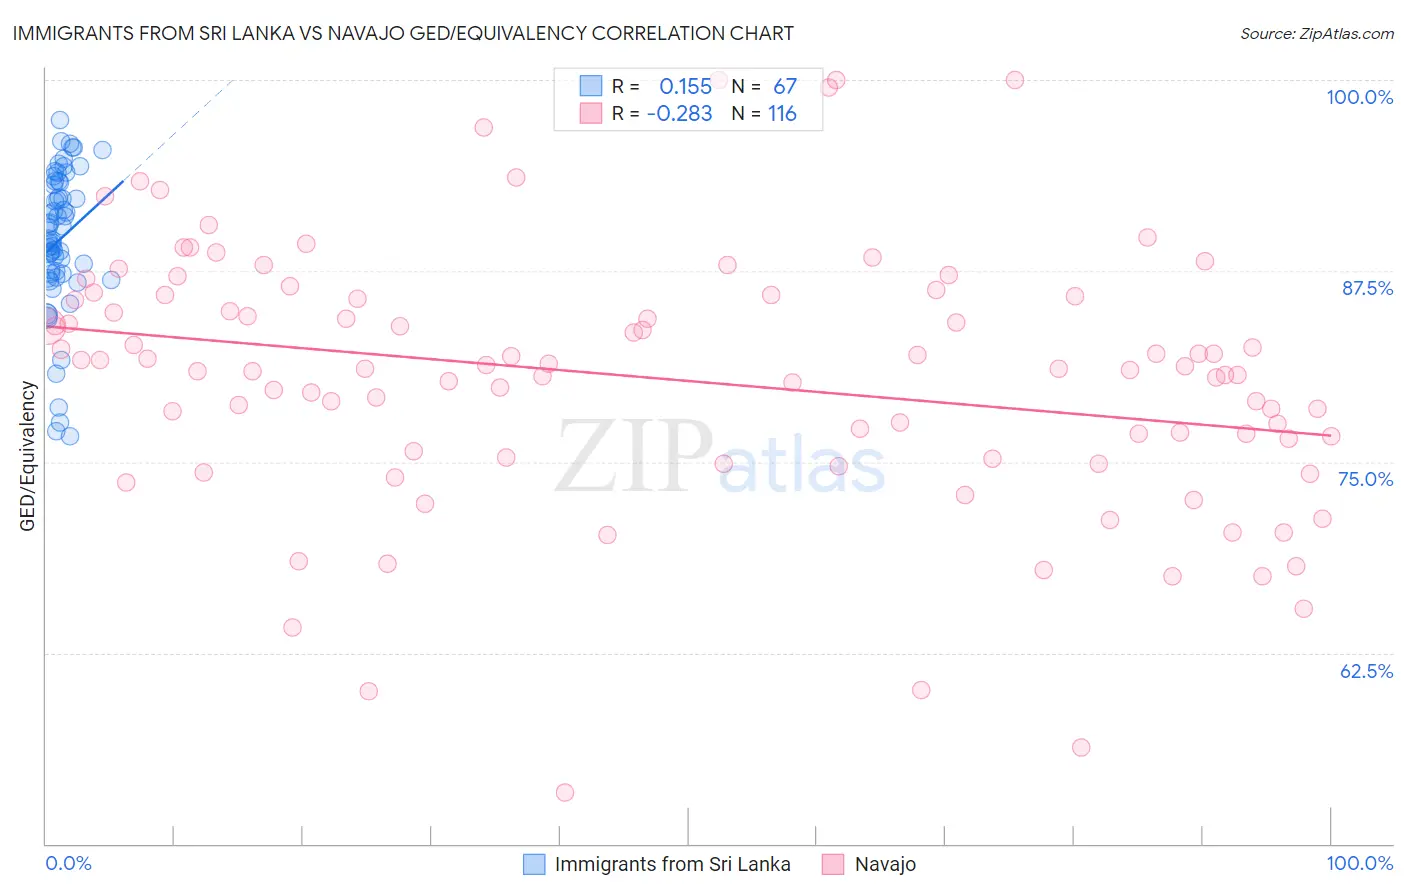
Immigrants from Sri Lanka vs Navajo GED/Equivalency Correlation Chart
The statistical analysis conducted on geographies consisting of 149,671,972 people shows a poor positive correlation between the proportion of Immigrants from Sri Lanka and percentage of population with at least ged/equivalency education in the United States with a correlation coefficient (R) of 0.155 and weighted average of 87.5%. Similarly, the statistical analysis conducted on geographies consisting of 224,872,856 people shows a weak negative correlation between the proportion of Navajo and percentage of population with at least ged/equivalency education in the United States with a correlation coefficient (R) of -0.283 and weighted average of 81.5%, a difference of 7.4%.
GED/Equivalency Correlation Summary
| Measurement | Immigrants from Sri Lanka | Navajo |
| Minimum | 76.7% | 53.3% |
| Maximum | 97.4% | 100.0% |
| Range | 20.7% | 46.7% |
| Mean | 89.5% | 80.4% |
| Median | 89.6% | 81.1% |
| Interquartile 25% (IQ1) | 87.3% | 75.5% |
| Interquartile 75% (IQ3) | 93.3% | 85.8% |
| Interquartile Range (IQR) | 6.0% | 10.3% |
| Standard Deviation (Sample) | 4.6% | 8.6% |
| Standard Deviation (Population) | 4.6% | 8.5% |
Similar Demographics by GED/Equivalency
Demographics Similar to Immigrants from Sri Lanka by GED/Equivalency
In terms of ged/equivalency, the demographic groups most similar to Immigrants from Sri Lanka are Romanian (87.5%, a difference of 0.010%), South African (87.5%, a difference of 0.010%), Immigrants from England (87.6%, a difference of 0.040%), Immigrants from Romania (87.5%, a difference of 0.050%), and Dutch (87.5%, a difference of 0.050%).
| Demographics | Rating | Rank | GED/Equivalency |
| Immigrants | Kuwait | 98.8 /100 | #74 | Exceptional 87.7% |
| Scottish | 98.7 /100 | #75 | Exceptional 87.7% |
| Immigrants | Serbia | 98.7 /100 | #76 | Exceptional 87.7% |
| Slavs | 98.7 /100 | #77 | Exceptional 87.7% |
| Irish | 98.6 /100 | #78 | Exceptional 87.6% |
| English | 98.6 /100 | #79 | Exceptional 87.6% |
| Immigrants | England | 98.5 /100 | #80 | Exceptional 87.6% |
| Immigrants | Sri Lanka | 98.3 /100 | #81 | Exceptional 87.5% |
| Romanians | 98.3 /100 | #82 | Exceptional 87.5% |
| South Africans | 98.3 /100 | #83 | Exceptional 87.5% |
| Immigrants | Romania | 98.1 /100 | #84 | Exceptional 87.5% |
| Dutch | 98.1 /100 | #85 | Exceptional 87.5% |
| Immigrants | Europe | 98.1 /100 | #86 | Exceptional 87.5% |
| Native Hawaiians | 98.1 /100 | #87 | Exceptional 87.5% |
| Immigrants | Norway | 98.1 /100 | #88 | Exceptional 87.5% |
Demographics Similar to Navajo by GED/Equivalency
In terms of ged/equivalency, the demographic groups most similar to Navajo are Immigrants from Haiti (81.6%, a difference of 0.10%), Immigrants from Portugal (81.6%, a difference of 0.10%), Dutch West Indian (81.6%, a difference of 0.14%), Fijian (81.6%, a difference of 0.20%), and Immigrants from Grenada (81.3%, a difference of 0.21%).
| Demographics | Rating | Rank | GED/Equivalency |
| Immigrants | Bangladesh | 0.0 /100 | #297 | Tragic 81.9% |
| Ute | 0.0 /100 | #298 | Tragic 81.8% |
| Ecuadorians | 0.0 /100 | #299 | Tragic 81.7% |
| Fijians | 0.0 /100 | #300 | Tragic 81.6% |
| Dutch West Indians | 0.0 /100 | #301 | Tragic 81.6% |
| Immigrants | Haiti | 0.0 /100 | #302 | Tragic 81.6% |
| Immigrants | Portugal | 0.0 /100 | #303 | Tragic 81.6% |
| Navajo | 0.0 /100 | #304 | Tragic 81.5% |
| Immigrants | Grenada | 0.0 /100 | #305 | Tragic 81.3% |
| Guyanese | 0.0 /100 | #306 | Tragic 81.3% |
| Immigrants | Dominica | 0.0 /100 | #307 | Tragic 81.1% |
| Puerto Ricans | 0.0 /100 | #308 | Tragic 81.1% |
| Immigrants | Ecuador | 0.0 /100 | #309 | Tragic 81.0% |
| Immigrants | Guyana | 0.0 /100 | #310 | Tragic 81.0% |
| Natives/Alaskans | 0.0 /100 | #311 | Tragic 80.9% |