Immigrants from Colombia vs Carpatho Rusyn 12th Grade, No Diploma
COMPARE
Immigrants from Colombia
Carpatho Rusyn
12th Grade, No Diploma
12th Grade, No Diploma Comparison
Immigrants from Colombia
Carpatho Rusyns
90.1%
12TH GRADE, NO DIPLOMA
2.1/ 100
METRIC RATING
237th/ 347
METRIC RANK
93.6%
12TH GRADE, NO DIPLOMA
100.0/ 100
METRIC RATING
5th/ 347
METRIC RANK
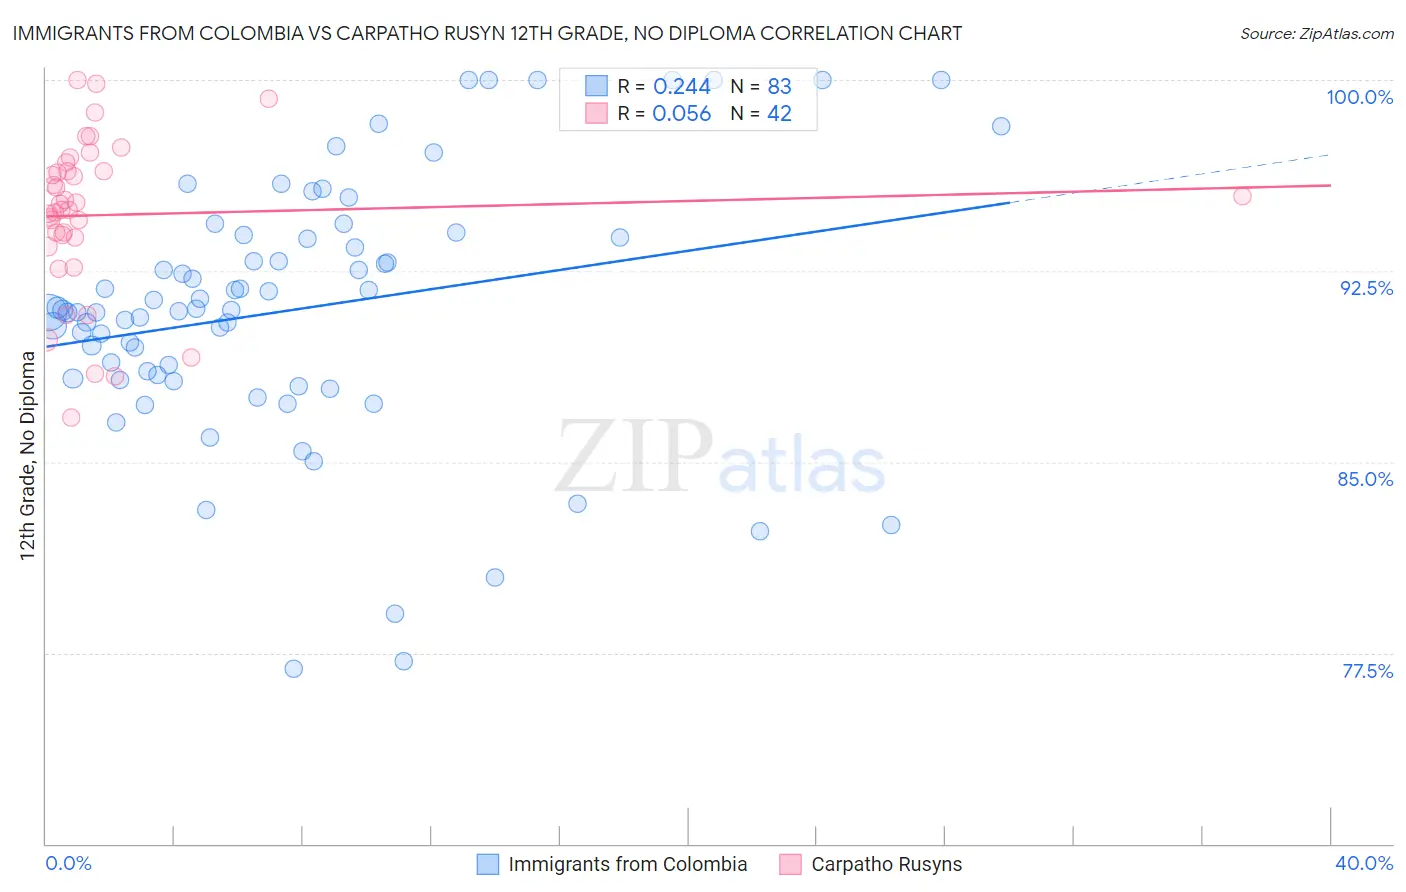
Immigrants from Colombia vs Carpatho Rusyn 12th Grade, No Diploma Correlation Chart
The statistical analysis conducted on geographies consisting of 378,643,826 people shows a weak positive correlation between the proportion of Immigrants from Colombia and percentage of population with at least 12th grade (no diploma) education in the United States with a correlation coefficient (R) of 0.244 and weighted average of 90.1%. Similarly, the statistical analysis conducted on geographies consisting of 58,871,690 people shows a slight positive correlation between the proportion of Carpatho Rusyns and percentage of population with at least 12th grade (no diploma) education in the United States with a correlation coefficient (R) of 0.056 and weighted average of 93.6%, a difference of 3.9%.
12th Grade, No Diploma Correlation Summary
| Measurement | Immigrants from Colombia | Carpatho Rusyn |
| Minimum | 76.9% | 86.7% |
| Maximum | 100.0% | 100.0% |
| Range | 23.1% | 13.3% |
| Mean | 91.0% | 94.7% |
| Median | 90.9% | 95.0% |
| Interquartile 25% (IQ1) | 88.3% | 93.8% |
| Interquartile 75% (IQ3) | 93.8% | 96.4% |
| Interquartile Range (IQR) | 5.5% | 2.6% |
| Standard Deviation (Sample) | 5.1% | 3.1% |
| Standard Deviation (Population) | 5.0% | 3.1% |
Similar Demographics by 12th Grade, No Diploma
Demographics Similar to Immigrants from Colombia by 12th Grade, No Diploma
In terms of 12th grade, no diploma, the demographic groups most similar to Immigrants from Colombia are Inupiat (90.1%, a difference of 0.010%), Immigrants from Thailand (90.1%, a difference of 0.030%), Immigrants from South America (90.1%, a difference of 0.030%), Colville (90.1%, a difference of 0.030%), and Immigrants from Uzbekistan (90.1%, a difference of 0.030%).
| Demographics | Rating | Rank | 12th Grade, No Diploma |
| Immigrants | Philippines | 2.8 /100 | #230 | Tragic 90.2% |
| Peruvians | 2.7 /100 | #231 | Tragic 90.2% |
| Blackfeet | 2.4 /100 | #232 | Tragic 90.1% |
| Immigrants | Thailand | 2.3 /100 | #233 | Tragic 90.1% |
| Immigrants | South America | 2.3 /100 | #234 | Tragic 90.1% |
| Colville | 2.3 /100 | #235 | Tragic 90.1% |
| Immigrants | Uzbekistan | 2.2 /100 | #236 | Tragic 90.1% |
| Immigrants | Colombia | 2.1 /100 | #237 | Tragic 90.1% |
| Inupiat | 2.0 /100 | #238 | Tragic 90.1% |
| Sub-Saharan Africans | 1.9 /100 | #239 | Tragic 90.1% |
| Kiowa | 1.7 /100 | #240 | Tragic 90.0% |
| Immigrants | Middle Africa | 1.7 /100 | #241 | Tragic 90.0% |
| Immigrants | Costa Rica | 1.6 /100 | #242 | Tragic 90.0% |
| Crow | 1.5 /100 | #243 | Tragic 90.0% |
| Taiwanese | 1.5 /100 | #244 | Tragic 90.0% |
Demographics Similar to Carpatho Rusyns by 12th Grade, No Diploma
In terms of 12th grade, no diploma, the demographic groups most similar to Carpatho Rusyns are Slovene (93.6%, a difference of 0.010%), Immigrants from India (93.6%, a difference of 0.010%), Lithuanian (93.6%, a difference of 0.020%), Slovak (93.6%, a difference of 0.050%), and Chinese (93.6%, a difference of 0.060%).
| Demographics | Rating | Rank | 12th Grade, No Diploma |
| Norwegians | 100.0 /100 | #1 | Exceptional 94.0% |
| Swedes | 100.0 /100 | #2 | Exceptional 93.7% |
| Lithuanians | 100.0 /100 | #3 | Exceptional 93.6% |
| Slovenes | 100.0 /100 | #4 | Exceptional 93.6% |
| Carpatho Rusyns | 100.0 /100 | #5 | Exceptional 93.6% |
| Immigrants | India | 100.0 /100 | #6 | Exceptional 93.6% |
| Slovaks | 100.0 /100 | #7 | Exceptional 93.6% |
| Chinese | 100.0 /100 | #8 | Exceptional 93.6% |
| Latvians | 100.0 /100 | #9 | Exceptional 93.6% |
| Croatians | 100.0 /100 | #10 | Exceptional 93.5% |
| Poles | 100.0 /100 | #11 | Exceptional 93.5% |
| Eastern Europeans | 100.0 /100 | #12 | Exceptional 93.5% |
| Danes | 100.0 /100 | #13 | Exceptional 93.5% |
| Bulgarians | 100.0 /100 | #14 | Exceptional 93.5% |
| Finns | 100.0 /100 | #15 | Exceptional 93.4% |