Australian vs Iraqi High School Diploma

COMPARE

Australian
Race
Ancestry
AfghanAfricanAlaska NativeAlaskan AthabascanAlbanianAleutAlsatianAmericanApacheArabArapahoArgentineanArmenianAssyrian/Chaldean/SyriacAustralianAustrianBahamianBangladeshiBarbadianBasqueBelgianBelizeanBermudanBhutaneseBlackfeetBolivianBrazilianBritishBritish West IndianBulgarianBurmeseCajunCambodianCanadianCape VerdeanCarpatho RusynCelticCentral AmericanCentral American IndianCherokeeCheyenneChickasawChileanChineseChippewaChoctawColombianColvilleComancheCosta RicanCreeCreekCroatianCrowCubanCypriotCzechCzechoslovakianDanishDelawareDominicanDutchDutch West IndianEastern EuropeanEcuadorianEgyptianEnglishEstonianEthiopianEuropeanFijianFilipinoFinnishFrenchFrench American IndianFrench CanadianGermanGerman RussianGhanaianGreekGuamanian/ChamorroGuatemalanGuyaneseHaitianHmongHonduranHopiHoumaHungarianIcelanderIndian (Asian)IndonesianInupiatIranianIrishIroquoisIsraeliItalianJamaicanJapaneseJordanianKenyanKiowaKoreanLaotianLatvianLebaneseLiberianLithuanianLumbeeLuxembourgerMacedonianMalaysianMalteseMarshalleseMenomineeMexicanMexican American IndianMongolianMoroccanNative HawaiianNavajoNepaleseNew ZealanderNicaraguanNigerianNorthern EuropeanNorwegianOkinawanOsageOttawaPaiutePakistaniPalestinianPanamanianParaguayanPennsylvania GermanPeruvianPimaPolishPortuguesePotawatomiPuebloPuerto RicanPuget Sound SalishRomanianRussianSalvadoranSamoanScandinavianScotch-IrishScottishSeminoleSenegaleseSerbianShoshoneSierra LeoneanSiouxSlavicSlovakSloveneSomaliSouth AfricanSouth AmericanSouth American IndianSoviet UnionSpaniardSpanishSpanish AmericanSpanish American IndianSri LankanSubsaharan AfricanSudaneseSwedishSwissSyrianTaiwaneseThaiTlingit-HaidaTohono O'OdhamTonganTrinidadian and TobagonianTsimshianTurkishU.S. Virgin IslanderUgandanUkrainianUruguayanUteVenezuelanVietnameseWelshWest IndianYakamaYaquiYugoslavianYumanYup'ikZimbabwean
Immigration
NonimmigrantsImmigrantsAfghanistanAfricaAlbaniaArgentinaArmeniaAsiaAustraliaAustriaBahamasBangladeshBarbadosBelarusBelgiumBelizeBoliviaBosnia and HerzegovinaBrazilBulgariaBurma/MyanmarCabo VerdeCambodiaCameroonCanadaCaribbeanCentral AmericaChileChinaColombiaCongoCosta RicaCroatiaCubaCzechoslovakiaDenmarkDominicaDominican RepublicEastern AfricaEastern AsiaEastern EuropeEcuadorEgyptEl SalvadorEnglandEritreaEthiopiaEuropeFijiFranceGermanyGhanaGreeceGrenadaGuatemalaGuyanaHaitiHondurasHong KongHungaryIndiaIndonesiaIranIraqIrelandIsraelItalyJamaicaJapanJordanKazakhstanKenyaKoreaKuwaitLaosLatin AmericaLatviaLebanonLiberiaLithuaniaMalaysiaMexicoMicronesiaMiddle AfricaMoldovaMoroccoNepalNetherlandsNicaraguaNigeriaNorth AmericaNorth MacedoniaNorthern AfricaNorthern EuropeNorwayOceaniaPakistanPanamaPeruPhilippinesPolandPortugalRomaniaRussiaSaudi ArabiaScotlandSenegalSerbiaSierra LeoneSingaporeSomaliaSouth AfricaSouth AmericaSouth Central AsiaSouth Eastern AsiaSouthern EuropeSpainSri LankaSt. Vincent and the GrenadinesSudanSwedenSwitzerlandSyriaTaiwanThailandTrinidad and TobagoTurkeyUgandaUkraineUruguayUzbekistanVenezuelaVietnamWest IndiesWestern AfricaWestern AsiaWestern EuropeYemenZaireZimbabweAzores
Iraqi
Race
Ancestry
AfghanAfricanAlaska NativeAlaskan AthabascanAlbanianAleutAlsatianAmericanApacheArabArapahoArgentineanArmenianAssyrian/Chaldean/SyriacAustrianBahamianBangladeshiBarbadianBasqueBelgianBelizeanBermudanBhutaneseBlackfeetBolivianBrazilianBritishBritish West IndianBulgarianBurmeseCajunCambodianCanadianCape VerdeanCarpatho RusynCelticCentral AmericanCentral American IndianCherokeeCheyenneChickasawChileanChineseChippewaChoctawColombianColvilleComancheCosta RicanCreeCreekCroatianCrowCubanCypriotCzechCzechoslovakianDanishDelawareDominicanDutchDutch West IndianEastern EuropeanEcuadorianEgyptianEnglishEstonianEthiopianEuropeanFijianFilipinoFinnishFrenchFrench American IndianFrench CanadianGermanGerman RussianGhanaianGreekGuamanian/ChamorroGuatemalanGuyaneseHaitianHmongHonduranHopiHoumaHungarianIcelanderIndian (Asian)IndonesianInupiatIranianIraqiIrishIroquoisIsraeliItalianJamaicanJapaneseJordanianKenyanKiowaKoreanLaotianLatvianLebaneseLiberianLithuanianLumbeeLuxembourgerMacedonianMalaysianMalteseMarshalleseMenomineeMexicanMexican American IndianMongolianMoroccanNative HawaiianNavajoNepaleseNew ZealanderNicaraguanNigerianNorthern EuropeanNorwegianOkinawanOsageOttawaPaiutePakistaniPalestinianPanamanianParaguayanPennsylvania GermanPeruvianPimaPolishPortuguesePotawatomiPuebloPuerto RicanPuget Sound SalishRomanianRussianSalvadoranSamoanScandinavianScotch-IrishScottishSeminoleSenegaleseSerbianShoshoneSierra LeoneanSiouxSlavicSlovakSloveneSomaliSouth AfricanSouth AmericanSouth American IndianSoviet UnionSpaniardSpanishSpanish AmericanSpanish American IndianSri LankanSubsaharan AfricanSudaneseSwedishSwissSyrianTaiwaneseThaiTlingit-HaidaTohono O'OdhamTonganTrinidadian and TobagonianTsimshianTurkishU.S. Virgin IslanderUgandanUkrainianUruguayanUteVenezuelanVietnameseWelshWest IndianYakamaYaquiYugoslavianYumanYup'ikZimbabwean
Immigration
NonimmigrantsImmigrantsAfghanistanAfricaAlbaniaArgentinaArmeniaAsiaAustraliaAustriaBahamasBangladeshBarbadosBelarusBelgiumBelizeBoliviaBosnia and HerzegovinaBrazilBulgariaBurma/MyanmarCabo VerdeCambodiaCameroonCanadaCaribbeanCentral AmericaChileChinaColombiaCongoCosta RicaCroatiaCubaCzechoslovakiaDenmarkDominicaDominican RepublicEastern AfricaEastern AsiaEastern EuropeEcuadorEgyptEl SalvadorEnglandEritreaEthiopiaEuropeFijiFranceGermanyGhanaGreeceGrenadaGuatemalaGuyanaHaitiHondurasHong KongHungaryIndiaIndonesiaIranIraqIrelandIsraelItalyJamaicaJapanJordanKazakhstanKenyaKoreaKuwaitLaosLatin AmericaLatviaLebanonLiberiaLithuaniaMalaysiaMexicoMicronesiaMiddle AfricaMoldovaMoroccoNepalNetherlandsNicaraguaNigeriaNorth AmericaNorth MacedoniaNorthern AfricaNorthern EuropeNorwayOceaniaPakistanPanamaPeruPhilippinesPolandPortugalRomaniaRussiaSaudi ArabiaScotlandSenegalSerbiaSierra LeoneSingaporeSomaliaSouth AfricaSouth AmericaSouth Central AsiaSouth Eastern AsiaSouthern EuropeSpainSri LankaSt. Vincent and the GrenadinesSudanSwedenSwitzerlandSyriaTaiwanThailandTrinidad and TobagoTurkeyUgandaUkraineUruguayUzbekistanVenezuelaVietnamWest IndiesWestern AfricaWestern AsiaWestern EuropeYemenZaireZimbabweAzores
High School Diploma
Income
Poverty
Unemployment
Labor Participation
Family Structure
Vehicle Availability
Education Level
Disability

High School Diploma Comparison

Australians

Iraqis

Exceptional
Good
91.2%
HIGH SCHOOL DIPLOMA
99.8/ 100
METRIC RATING
47th/ 347
METRIC RANK
89.5%
HIGH SCHOOL DIPLOMA
73.9/ 100
METRIC RATING
147th/ 347
METRIC RANK

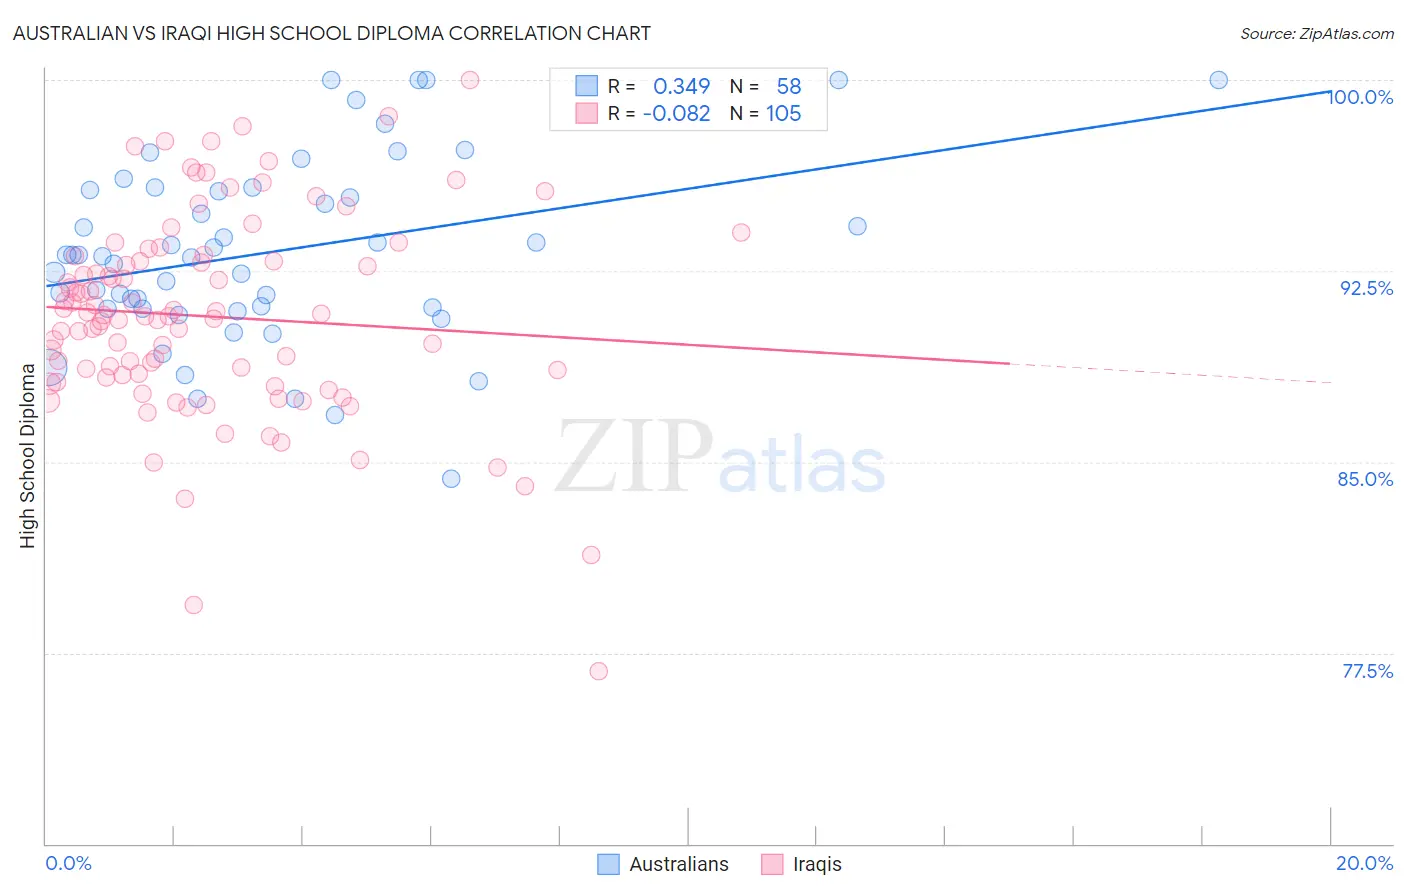
Australian vs Iraqi High School Diploma Correlation Chart

The statistical analysis conducted on geographies consisting of 224,152,919 people shows a mild positive correlation between the proportion of Australians and percentage of population with at least high school diploma education in the United States with a correlation coefficient (R) of 0.349 and weighted average of 91.2%. Similarly, the statistical analysis conducted on geographies consisting of 170,614,457 people shows a slight negative correlation between the proportion of Iraqis and percentage of population with at least high school diploma education in the United States with a correlation coefficient (R) of -0.082 and weighted average of 89.5%, a difference of 1.9%.
Australian vs Iraqi High School Diploma

High School Diploma Correlation Summary

MeasurementAustralianIraqi
Minimum84.3%76.8%
Maximum100.0%100.0%
Range15.7%23.2%
Mean93.3%90.7%
Median93.1%90.7%
Interquartile 25% (IQ1)91.0%88.4%
Interquartile 75% (IQ3)95.7%93.0%
Interquartile Range (IQR)4.7%4.6%
Standard Deviation (Sample)3.6%4.0%
Standard Deviation (Population)3.6%4.0%

Similar Demographics by High School Diploma

Demographics Similar to Australians by High School Diploma

In terms of high school diploma, the demographic groups most similar to Australians are Belgian (91.2%, a difference of 0.0%), Greek (91.2%, a difference of 0.010%), Bhutanese (91.2%, a difference of 0.010%), Welsh (91.2%, a difference of 0.030%), and Immigrants from Austria (91.3%, a difference of 0.050%).
DemographicsRating | RankHigh School Diploma
Immigrants | Lithuania
99.8
/100
|
#40
Exceptional
91.3%
Immigrants | Australia
99.8
/100
|
#41
Exceptional
91.3%
Northern Europeans
99.8
/100
|
#42
Exceptional
91.3%
British
99.8
/100
|
#43
Exceptional
91.3%
Immigrants | Austria
99.8
/100
|
#44
Exceptional
91.3%
Turks
99.8
/100
|
#45
Exceptional
91.2%
Greeks
99.8
/100
|
#46
Exceptional
91.2%
Australians
99.8
/100
|
#47
Exceptional
91.2%
Belgians
99.8
/100
|
#48
Exceptional
91.2%
Bhutanese
99.8
/100
|
#49
Exceptional
91.2%
Welsh
99.8
/100
|
#50
Exceptional
91.2%
New Zealanders
99.7
/100
|
#51
Exceptional
91.1%
Immigrants | Sweden
99.7
/100
|
#52
Exceptional
91.1%
Immigrants | Belgium
99.7
/100
|
#53
Exceptional
91.1%
Macedonians
99.7
/100
|
#54
Exceptional
91.1%

Demographics Similar to Iraqis by High School Diploma

In terms of high school diploma, the demographic groups most similar to Iraqis are Immigrants from Lebanon (89.5%, a difference of 0.010%), Immigrants from Poland (89.5%, a difference of 0.020%), Argentinean (89.5%, a difference of 0.030%), Immigrants from Brazil (89.5%, a difference of 0.050%), and Immigrants from Spain (89.5%, a difference of 0.050%).
DemographicsRating | RankHigh School Diploma
Immigrants | Egypt
81.2
/100
|
#140
Excellent
89.6%
Chileans
79.0
/100
|
#141
Good
89.6%
Indians (Asian)
78.8
/100
|
#142
Good
89.6%
Pakistanis
78.3
/100
|
#143
Good
89.6%
Immigrants | Kenya
78.0
/100
|
#144
Good
89.6%
Immigrants | Brazil
76.6
/100
|
#145
Good
89.5%
Immigrants | Spain
76.2
/100
|
#146
Good
89.5%
Iraqis
73.9
/100
|
#147
Good
89.5%
Immigrants | Lebanon
73.4
/100
|
#148
Good
89.5%
Immigrants | Poland
72.9
/100
|
#149
Good
89.5%
Argentineans
72.3
/100
|
#150
Good
89.5%
Paraguayans
71.4
/100
|
#151
Good
89.5%
Asians
70.7
/100
|
#152
Good
89.4%
Immigrants | Iraq
68.7
/100
|
#153
Good
89.4%
Alsatians
66.8
/100
|
#154
Good
89.4%