Subsaharan African vs Immigrants from England 5th Grade
COMPARE
Subsaharan African
Immigrants from England
5th Grade
5th Grade Comparison
Sub-Saharan Africans
Immigrants from England
97.0%
5TH GRADE
3.3/ 100
METRIC RATING
233rd/ 347
METRIC RANK
97.8%
5TH GRADE
99.3/ 100
METRIC RATING
77th/ 347
METRIC RANK
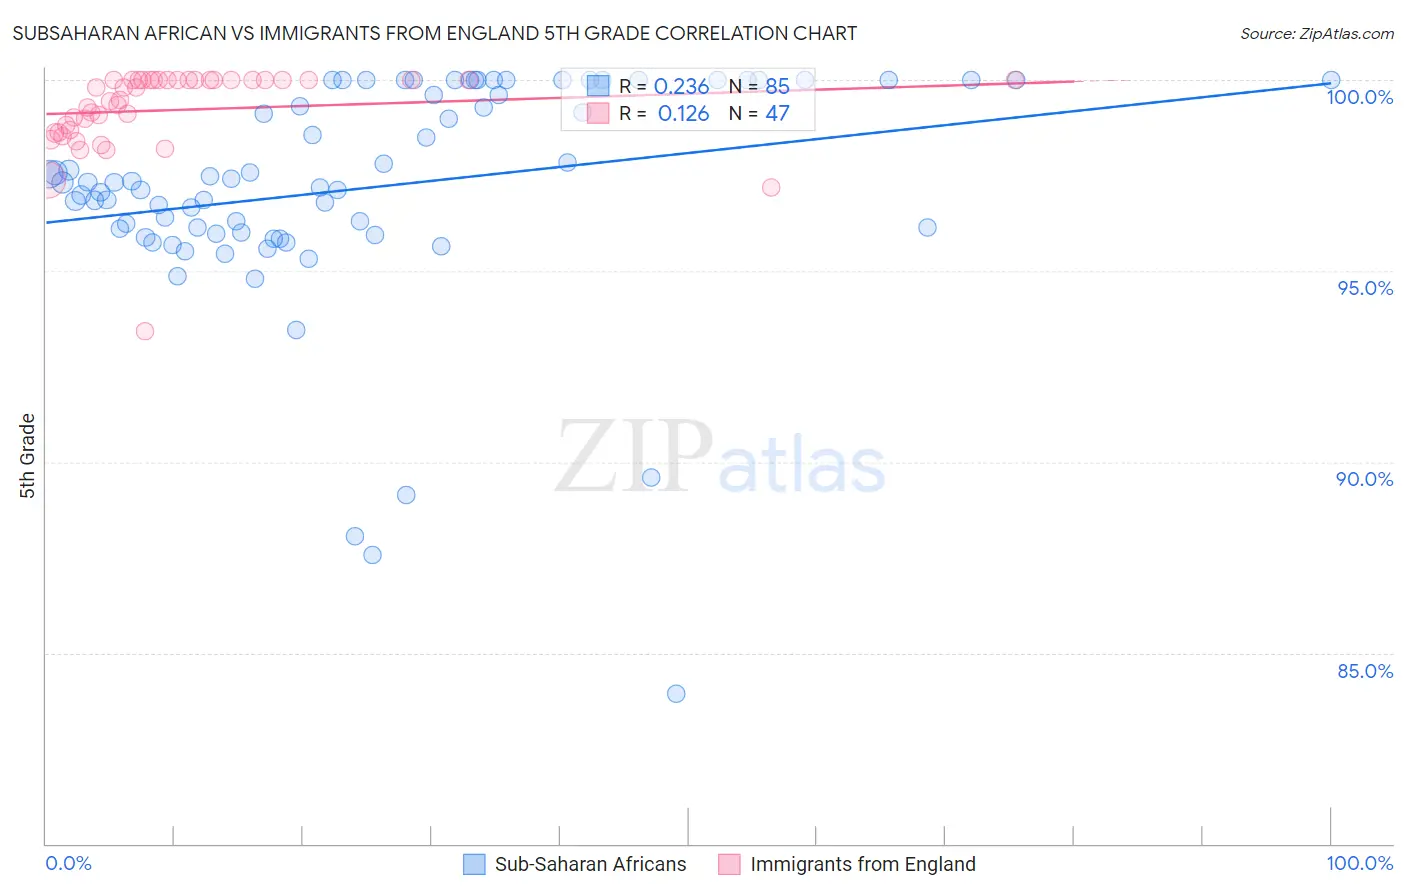
Subsaharan African vs Immigrants from England 5th Grade Correlation Chart
The statistical analysis conducted on geographies consisting of 508,219,094 people shows a weak positive correlation between the proportion of Sub-Saharan Africans and percentage of population with at least 5th grade education in the United States with a correlation coefficient (R) of 0.236 and weighted average of 97.0%. Similarly, the statistical analysis conducted on geographies consisting of 391,898,018 people shows a poor positive correlation between the proportion of Immigrants from England and percentage of population with at least 5th grade education in the United States with a correlation coefficient (R) of 0.126 and weighted average of 97.8%, a difference of 0.87%.
5th Grade Correlation Summary
| Measurement | Subsaharan African | Immigrants from England |
| Minimum | 83.9% | 93.4% |
| Maximum | 100.0% | 100.0% |
| Range | 16.1% | 6.6% |
| Mean | 97.2% | 99.2% |
| Median | 97.3% | 99.8% |
| Interquartile 25% (IQ1) | 96.0% | 98.6% |
| Interquartile 75% (IQ3) | 100.0% | 100.0% |
| Interquartile Range (IQR) | 4.0% | 1.4% |
| Standard Deviation (Sample) | 3.0% | 1.2% |
| Standard Deviation (Population) | 3.0% | 1.1% |
Similar Demographics by 5th Grade
Demographics Similar to Sub-Saharan Africans by 5th Grade
In terms of 5th grade, the demographic groups most similar to Sub-Saharan Africans are Tohono O'odham (97.0%, a difference of 0.0%), Uruguayan (97.0%, a difference of 0.0%), Immigrants from Malaysia (97.0%, a difference of 0.020%), Immigrants from Eastern Asia (97.0%, a difference of 0.020%), and Senegalese (97.0%, a difference of 0.020%).
| Demographics | Rating | Rank | 5th Grade |
| Tongans | 5.3 /100 | #226 | Tragic 97.0% |
| Immigrants | Pakistan | 4.7 /100 | #227 | Tragic 97.0% |
| Assyrians/Chaldeans/Syriacs | 4.5 /100 | #228 | Tragic 97.0% |
| Yuman | 4.5 /100 | #229 | Tragic 97.0% |
| Immigrants | Western Asia | 4.3 /100 | #230 | Tragic 97.0% |
| Immigrants | Malaysia | 4.1 /100 | #231 | Tragic 97.0% |
| Immigrants | Eastern Asia | 4.0 /100 | #232 | Tragic 97.0% |
| Sub-Saharan Africans | 3.3 /100 | #233 | Tragic 97.0% |
| Tohono O'odham | 3.2 /100 | #234 | Tragic 97.0% |
| Uruguayans | 3.2 /100 | #235 | Tragic 97.0% |
| Senegalese | 2.8 /100 | #236 | Tragic 97.0% |
| Immigrants | Indonesia | 2.0 /100 | #237 | Tragic 96.9% |
| Asians | 2.0 /100 | #238 | Tragic 96.9% |
| Nigerians | 1.9 /100 | #239 | Tragic 96.9% |
| Indians (Asian) | 1.9 /100 | #240 | Tragic 96.9% |
Demographics Similar to Immigrants from England by 5th Grade
In terms of 5th grade, the demographic groups most similar to Immigrants from England are Ukrainian (97.8%, a difference of 0.0%), Immigrants from Netherlands (97.8%, a difference of 0.0%), Cherokee (97.8%, a difference of 0.010%), Lumbee (97.8%, a difference of 0.010%), and Osage (97.8%, a difference of 0.010%).
| Demographics | Rating | Rank | 5th Grade |
| Iranians | 99.5 /100 | #70 | Exceptional 97.9% |
| Chickasaw | 99.5 /100 | #71 | Exceptional 97.9% |
| Macedonians | 99.4 /100 | #72 | Exceptional 97.9% |
| Cherokee | 99.4 /100 | #73 | Exceptional 97.8% |
| Lumbee | 99.3 /100 | #74 | Exceptional 97.8% |
| Ukrainians | 99.3 /100 | #75 | Exceptional 97.8% |
| Immigrants | Netherlands | 99.3 /100 | #76 | Exceptional 97.8% |
| Immigrants | England | 99.3 /100 | #77 | Exceptional 97.8% |
| Osage | 99.3 /100 | #78 | Exceptional 97.8% |
| Immigrants | Lithuania | 99.2 /100 | #79 | Exceptional 97.8% |
| Immigrants | India | 99.2 /100 | #80 | Exceptional 97.8% |
| Icelanders | 99.2 /100 | #81 | Exceptional 97.8% |
| Pueblo | 99.2 /100 | #82 | Exceptional 97.8% |
| Zimbabweans | 99.0 /100 | #83 | Exceptional 97.8% |
| Potawatomi | 99.0 /100 | #84 | Exceptional 97.8% |