Immigrants from Japan vs Immigrants from England 5th Grade
COMPARE
Immigrants from Japan
Immigrants from England
5th Grade
5th Grade Comparison
Immigrants from Japan
Immigrants from England
97.6%
5TH GRADE
94.7/ 100
METRIC RATING
122nd/ 347
METRIC RANK
97.8%
5TH GRADE
99.3/ 100
METRIC RATING
77th/ 347
METRIC RANK
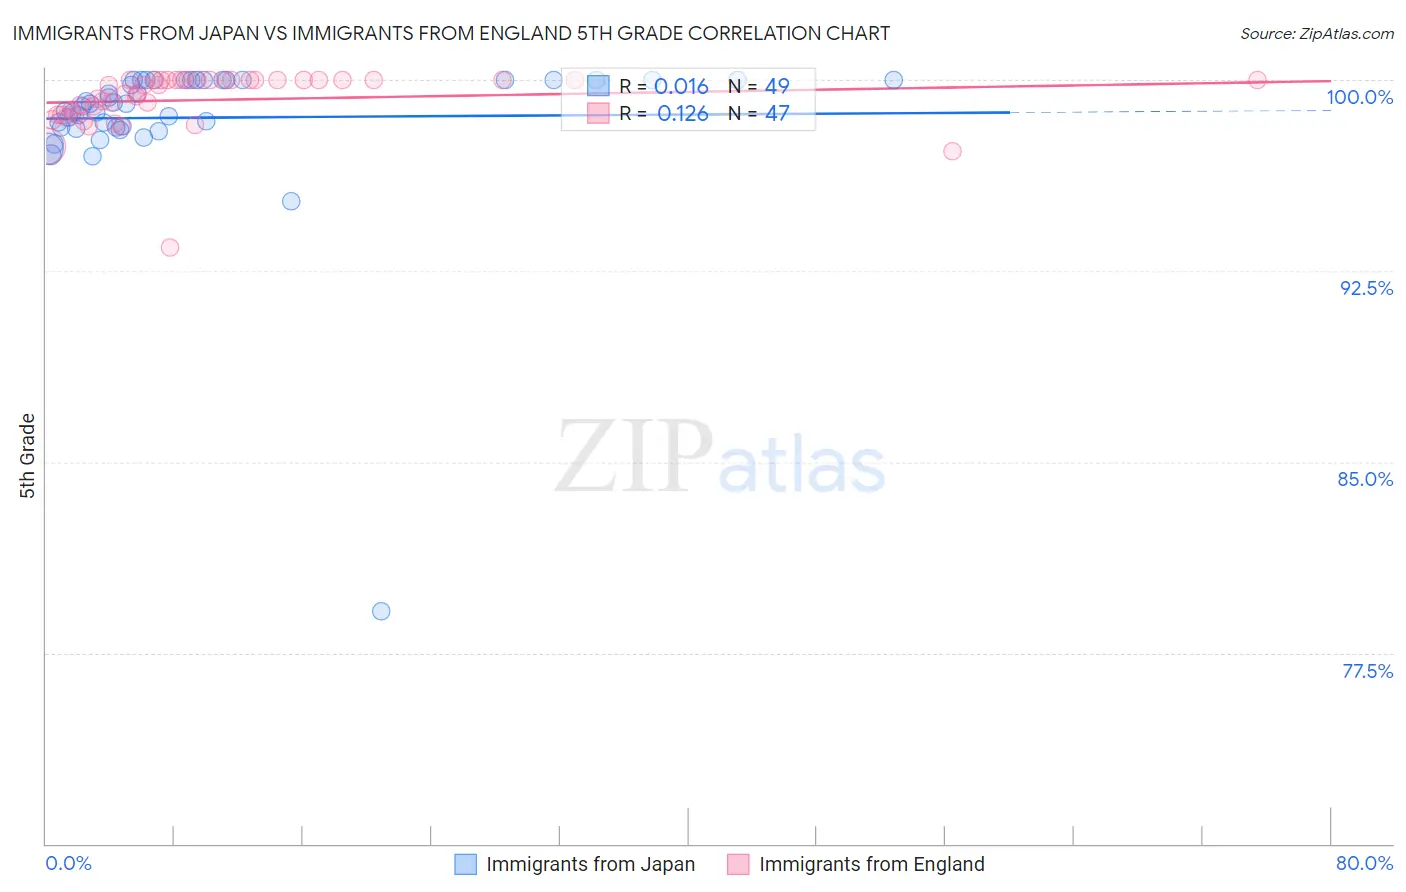
Immigrants from Japan vs Immigrants from England 5th Grade Correlation Chart
The statistical analysis conducted on geographies consisting of 340,148,942 people shows no correlation between the proportion of Immigrants from Japan and percentage of population with at least 5th grade education in the United States with a correlation coefficient (R) of 0.016 and weighted average of 97.6%. Similarly, the statistical analysis conducted on geographies consisting of 391,898,018 people shows a poor positive correlation between the proportion of Immigrants from England and percentage of population with at least 5th grade education in the United States with a correlation coefficient (R) of 0.126 and weighted average of 97.8%, a difference of 0.21%.
5th Grade Correlation Summary
| Measurement | Immigrants from Japan | Immigrants from England |
| Minimum | 79.1% | 93.4% |
| Maximum | 100.0% | 100.0% |
| Range | 20.9% | 6.6% |
| Mean | 98.5% | 99.2% |
| Median | 99.0% | 99.8% |
| Interquartile 25% (IQ1) | 98.2% | 98.6% |
| Interquartile 75% (IQ3) | 100.0% | 100.0% |
| Interquartile Range (IQR) | 1.8% | 1.4% |
| Standard Deviation (Sample) | 3.0% | 1.2% |
| Standard Deviation (Population) | 3.0% | 1.1% |
Similar Demographics by 5th Grade
Demographics Similar to Immigrants from Japan by 5th Grade
In terms of 5th grade, the demographic groups most similar to Immigrants from Japan are Immigrants from Zimbabwe (97.6%, a difference of 0.0%), Immigrants from France (97.6%, a difference of 0.0%), Immigrants from Norway (97.6%, a difference of 0.0%), Basque (97.6%, a difference of 0.010%), and Syrian (97.6%, a difference of 0.010%).
| Demographics | Rating | Rank | 5th Grade |
| Okinawans | 95.7 /100 | #115 | Exceptional 97.6% |
| Immigrants | Croatia | 95.5 /100 | #116 | Exceptional 97.6% |
| Immigrants | Saudi Arabia | 95.4 /100 | #117 | Exceptional 97.6% |
| Basques | 95.2 /100 | #118 | Exceptional 97.6% |
| Syrians | 95.1 /100 | #119 | Exceptional 97.6% |
| Immigrants | Zimbabwe | 94.9 /100 | #120 | Exceptional 97.6% |
| Immigrants | France | 94.8 /100 | #121 | Exceptional 97.6% |
| Immigrants | Japan | 94.7 /100 | #122 | Exceptional 97.6% |
| Immigrants | Norway | 94.6 /100 | #123 | Exceptional 97.6% |
| Spanish | 93.7 /100 | #124 | Exceptional 97.6% |
| Immigrants | Bulgaria | 93.1 /100 | #125 | Exceptional 97.6% |
| Hmong | 92.3 /100 | #126 | Exceptional 97.6% |
| Immigrants | Serbia | 92.3 /100 | #127 | Exceptional 97.6% |
| Colville | 92.0 /100 | #128 | Exceptional 97.6% |
| Immigrants | Europe | 91.9 /100 | #129 | Exceptional 97.6% |
Demographics Similar to Immigrants from England by 5th Grade
In terms of 5th grade, the demographic groups most similar to Immigrants from England are Ukrainian (97.8%, a difference of 0.0%), Immigrants from Netherlands (97.8%, a difference of 0.0%), Cherokee (97.8%, a difference of 0.010%), Lumbee (97.8%, a difference of 0.010%), and Osage (97.8%, a difference of 0.010%).
| Demographics | Rating | Rank | 5th Grade |
| Iranians | 99.5 /100 | #70 | Exceptional 97.9% |
| Chickasaw | 99.5 /100 | #71 | Exceptional 97.9% |
| Macedonians | 99.4 /100 | #72 | Exceptional 97.9% |
| Cherokee | 99.4 /100 | #73 | Exceptional 97.8% |
| Lumbee | 99.3 /100 | #74 | Exceptional 97.8% |
| Ukrainians | 99.3 /100 | #75 | Exceptional 97.8% |
| Immigrants | Netherlands | 99.3 /100 | #76 | Exceptional 97.8% |
| Immigrants | England | 99.3 /100 | #77 | Exceptional 97.8% |
| Osage | 99.3 /100 | #78 | Exceptional 97.8% |
| Immigrants | Lithuania | 99.2 /100 | #79 | Exceptional 97.8% |
| Immigrants | India | 99.2 /100 | #80 | Exceptional 97.8% |
| Icelanders | 99.2 /100 | #81 | Exceptional 97.8% |
| Pueblo | 99.2 /100 | #82 | Exceptional 97.8% |
| Zimbabweans | 99.0 /100 | #83 | Exceptional 97.8% |
| Potawatomi | 99.0 /100 | #84 | Exceptional 97.8% |