Sri Lankan vs Laotian College, Under 1 year
COMPARE
Sri Lankan
Laotian
College, Under 1 year
College, Under 1 year Comparison
Sri Lankans
Laotians
65.2%
COLLEGE, UNDER 1 YEAR
41.7/ 100
METRIC RATING
185th/ 347
METRIC RANK
68.5%
COLLEGE, UNDER 1 YEAR
98.6/ 100
METRIC RATING
76th/ 347
METRIC RANK
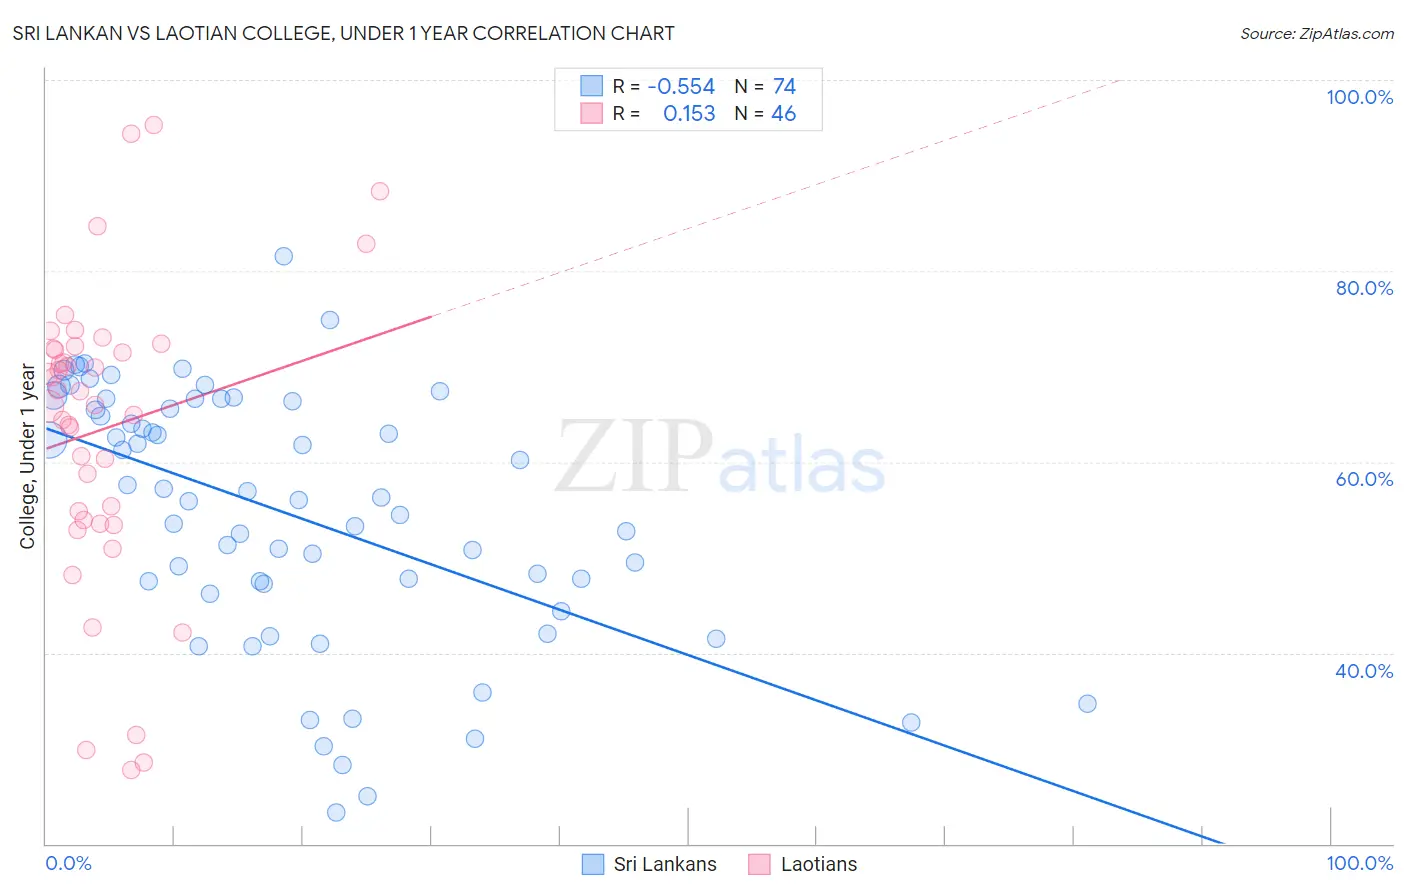
Sri Lankan vs Laotian College, Under 1 year Correlation Chart
The statistical analysis conducted on geographies consisting of 440,590,245 people shows a substantial negative correlation between the proportion of Sri Lankans and percentage of population with at least college, under 1 year education in the United States with a correlation coefficient (R) of -0.554 and weighted average of 65.2%. Similarly, the statistical analysis conducted on geographies consisting of 224,861,279 people shows a poor positive correlation between the proportion of Laotians and percentage of population with at least college, under 1 year education in the United States with a correlation coefficient (R) of 0.153 and weighted average of 68.5%, a difference of 5.1%.
College, Under 1 year Correlation Summary
| Measurement | Sri Lankan | Laotian |
| Minimum | 23.3% | 27.8% |
| Maximum | 81.5% | 95.2% |
| Range | 58.3% | 67.5% |
| Mean | 54.6% | 63.4% |
| Median | 56.1% | 66.6% |
| Interquartile 25% (IQ1) | 47.3% | 53.9% |
| Interquartile 75% (IQ3) | 66.4% | 71.9% |
| Interquartile Range (IQR) | 19.1% | 18.0% |
| Standard Deviation (Sample) | 13.3% | 15.7% |
| Standard Deviation (Population) | 13.2% | 15.5% |
Similar Demographics by College, Under 1 year
Demographics Similar to Sri Lankans by College, Under 1 year
In terms of college, under 1 year, the demographic groups most similar to Sri Lankans are Bermudan (65.2%, a difference of 0.010%), Immigrants from Poland (65.2%, a difference of 0.040%), Immigrants from Sierra Leone (65.1%, a difference of 0.090%), Immigrants from Africa (65.3%, a difference of 0.13%), and Spaniard (65.3%, a difference of 0.17%).
| Demographics | Rating | Rank | College, Under 1 year |
| German Russians | 48.3 /100 | #178 | Average 65.4% |
| Guamanians/Chamorros | 48.2 /100 | #179 | Average 65.4% |
| Dutch | 46.1 /100 | #180 | Average 65.3% |
| Spaniards | 45.5 /100 | #181 | Average 65.3% |
| Immigrants | Africa | 44.7 /100 | #182 | Average 65.3% |
| Immigrants | Poland | 42.6 /100 | #183 | Average 65.2% |
| Bermudans | 42.0 /100 | #184 | Average 65.2% |
| Sri Lankans | 41.7 /100 | #185 | Average 65.2% |
| Immigrants | Sierra Leone | 39.7 /100 | #186 | Fair 65.1% |
| Immigrants | Southern Europe | 34.3 /100 | #187 | Fair 64.9% |
| Immigrants | Albania | 32.0 /100 | #188 | Fair 64.9% |
| Spanish | 31.6 /100 | #189 | Fair 64.9% |
| Immigrants | Philippines | 30.1 /100 | #190 | Fair 64.8% |
| Immigrants | Armenia | 28.1 /100 | #191 | Fair 64.7% |
| Immigrants | Thailand | 27.0 /100 | #192 | Fair 64.7% |
Demographics Similar to Laotians by College, Under 1 year
In terms of college, under 1 year, the demographic groups most similar to Laotians are Immigrants from Western Europe (68.5%, a difference of 0.0%), British (68.5%, a difference of 0.040%), Danish (68.5%, a difference of 0.050%), Greek (68.5%, a difference of 0.070%), and Immigrants from Spain (68.4%, a difference of 0.090%).
| Demographics | Rating | Rank | College, Under 1 year |
| Immigrants | Romania | 99.2 /100 | #69 | Exceptional 68.9% |
| Lithuanians | 99.1 /100 | #70 | Exceptional 68.8% |
| Immigrants | Europe | 99.1 /100 | #71 | Exceptional 68.8% |
| Bolivians | 99.0 /100 | #72 | Exceptional 68.7% |
| Immigrants | England | 99.0 /100 | #73 | Exceptional 68.7% |
| Swedes | 98.9 /100 | #74 | Exceptional 68.7% |
| Immigrants | Western Europe | 98.6 /100 | #75 | Exceptional 68.5% |
| Laotians | 98.6 /100 | #76 | Exceptional 68.5% |
| British | 98.6 /100 | #77 | Exceptional 68.5% |
| Danes | 98.6 /100 | #78 | Exceptional 68.5% |
| Greeks | 98.6 /100 | #79 | Exceptional 68.5% |
| Immigrants | Spain | 98.5 /100 | #80 | Exceptional 68.4% |
| Immigrants | Greece | 98.5 /100 | #81 | Exceptional 68.4% |
| Norwegians | 98.4 /100 | #82 | Exceptional 68.4% |
| Argentineans | 98.4 /100 | #83 | Exceptional 68.4% |