Sri Lankan vs Alaskan Athabascan College, Under 1 year
COMPARE
Sri Lankan
Alaskan Athabascan
College, Under 1 year
College, Under 1 year Comparison
Sri Lankans
Alaskan Athabascans
65.2%
COLLEGE, UNDER 1 YEAR
41.7/ 100
METRIC RATING
185th/ 347
METRIC RANK
61.0%
COLLEGE, UNDER 1 YEAR
0.2/ 100
METRIC RATING
266th/ 347
METRIC RANK
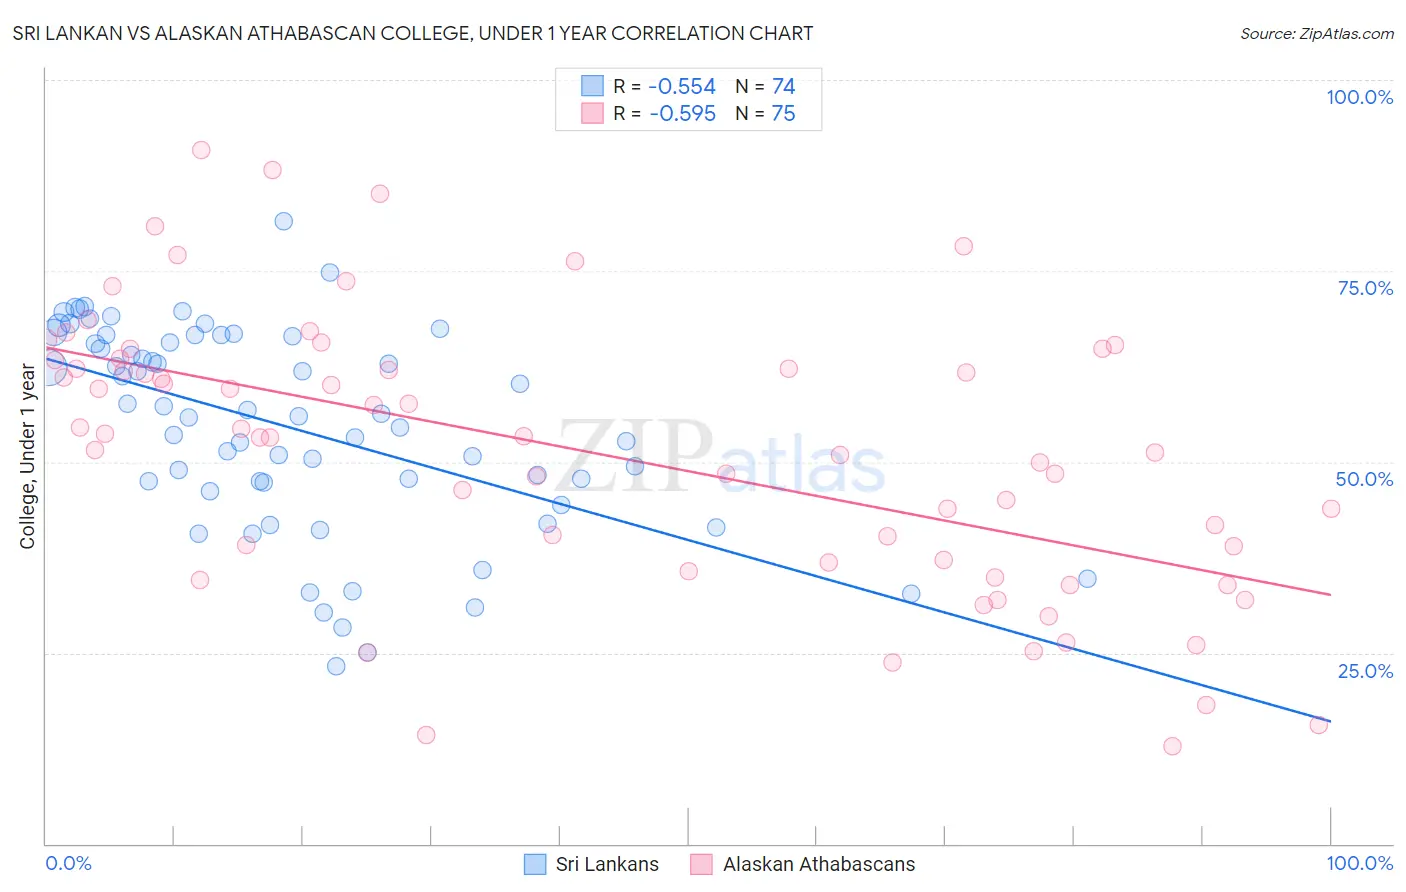
Sri Lankan vs Alaskan Athabascan College, Under 1 year Correlation Chart
The statistical analysis conducted on geographies consisting of 440,590,245 people shows a substantial negative correlation between the proportion of Sri Lankans and percentage of population with at least college, under 1 year education in the United States with a correlation coefficient (R) of -0.554 and weighted average of 65.2%. Similarly, the statistical analysis conducted on geographies consisting of 45,820,412 people shows a substantial negative correlation between the proportion of Alaskan Athabascans and percentage of population with at least college, under 1 year education in the United States with a correlation coefficient (R) of -0.595 and weighted average of 61.0%, a difference of 6.9%.
College, Under 1 year Correlation Summary
| Measurement | Sri Lankan | Alaskan Athabascan |
| Minimum | 23.3% | 12.7% |
| Maximum | 81.5% | 90.8% |
| Range | 58.3% | 78.1% |
| Mean | 54.6% | 51.2% |
| Median | 56.1% | 53.2% |
| Interquartile 25% (IQ1) | 47.3% | 36.8% |
| Interquartile 75% (IQ3) | 66.4% | 63.4% |
| Interquartile Range (IQR) | 19.1% | 26.5% |
| Standard Deviation (Sample) | 13.3% | 18.1% |
| Standard Deviation (Population) | 13.2% | 18.0% |
Similar Demographics by College, Under 1 year
Demographics Similar to Sri Lankans by College, Under 1 year
In terms of college, under 1 year, the demographic groups most similar to Sri Lankans are Bermudan (65.2%, a difference of 0.010%), Immigrants from Poland (65.2%, a difference of 0.040%), Immigrants from Sierra Leone (65.1%, a difference of 0.090%), Immigrants from Africa (65.3%, a difference of 0.13%), and Spaniard (65.3%, a difference of 0.17%).
| Demographics | Rating | Rank | College, Under 1 year |
| German Russians | 48.3 /100 | #178 | Average 65.4% |
| Guamanians/Chamorros | 48.2 /100 | #179 | Average 65.4% |
| Dutch | 46.1 /100 | #180 | Average 65.3% |
| Spaniards | 45.5 /100 | #181 | Average 65.3% |
| Immigrants | Africa | 44.7 /100 | #182 | Average 65.3% |
| Immigrants | Poland | 42.6 /100 | #183 | Average 65.2% |
| Bermudans | 42.0 /100 | #184 | Average 65.2% |
| Sri Lankans | 41.7 /100 | #185 | Average 65.2% |
| Immigrants | Sierra Leone | 39.7 /100 | #186 | Fair 65.1% |
| Immigrants | Southern Europe | 34.3 /100 | #187 | Fair 64.9% |
| Immigrants | Albania | 32.0 /100 | #188 | Fair 64.9% |
| Spanish | 31.6 /100 | #189 | Fair 64.9% |
| Immigrants | Philippines | 30.1 /100 | #190 | Fair 64.8% |
| Immigrants | Armenia | 28.1 /100 | #191 | Fair 64.7% |
| Immigrants | Thailand | 27.0 /100 | #192 | Fair 64.7% |
Demographics Similar to Alaskan Athabascans by College, Under 1 year
In terms of college, under 1 year, the demographic groups most similar to Alaskan Athabascans are American (61.0%, a difference of 0.010%), Trinidadian and Tobagonian (61.1%, a difference of 0.12%), Immigrants from Bahamas (61.1%, a difference of 0.12%), Barbadian (61.1%, a difference of 0.18%), and Shoshone (61.1%, a difference of 0.18%).
| Demographics | Rating | Rank | College, Under 1 year |
| Indonesians | 0.3 /100 | #259 | Tragic 61.2% |
| Blackfeet | 0.3 /100 | #260 | Tragic 61.1% |
| Africans | 0.3 /100 | #261 | Tragic 61.1% |
| Barbadians | 0.2 /100 | #262 | Tragic 61.1% |
| Shoshone | 0.2 /100 | #263 | Tragic 61.1% |
| Trinidadians and Tobagonians | 0.2 /100 | #264 | Tragic 61.1% |
| Immigrants | Bahamas | 0.2 /100 | #265 | Tragic 61.1% |
| Alaskan Athabascans | 0.2 /100 | #266 | Tragic 61.0% |
| Americans | 0.2 /100 | #267 | Tragic 61.0% |
| Immigrants | Trinidad and Tobago | 0.1 /100 | #268 | Tragic 60.7% |
| Immigrants | West Indies | 0.1 /100 | #269 | Tragic 60.6% |
| Cheyenne | 0.1 /100 | #270 | Tragic 60.6% |
| U.S. Virgin Islanders | 0.1 /100 | #271 | Tragic 60.6% |
| Jamaicans | 0.1 /100 | #272 | Tragic 60.5% |
| Chickasaw | 0.1 /100 | #273 | Tragic 60.4% |