Sri Lankan vs Paraguayan 12th Grade, No Diploma
COMPARE
Sri Lankan
Paraguayan
12th Grade, No Diploma
12th Grade, No Diploma Comparison
Sri Lankans
Paraguayans
89.4%
12TH GRADE, NO DIPLOMA
0.2/ 100
METRIC RATING
264th/ 347
METRIC RANK
91.5%
12TH GRADE, NO DIPLOMA
78.9/ 100
METRIC RATING
150th/ 347
METRIC RANK
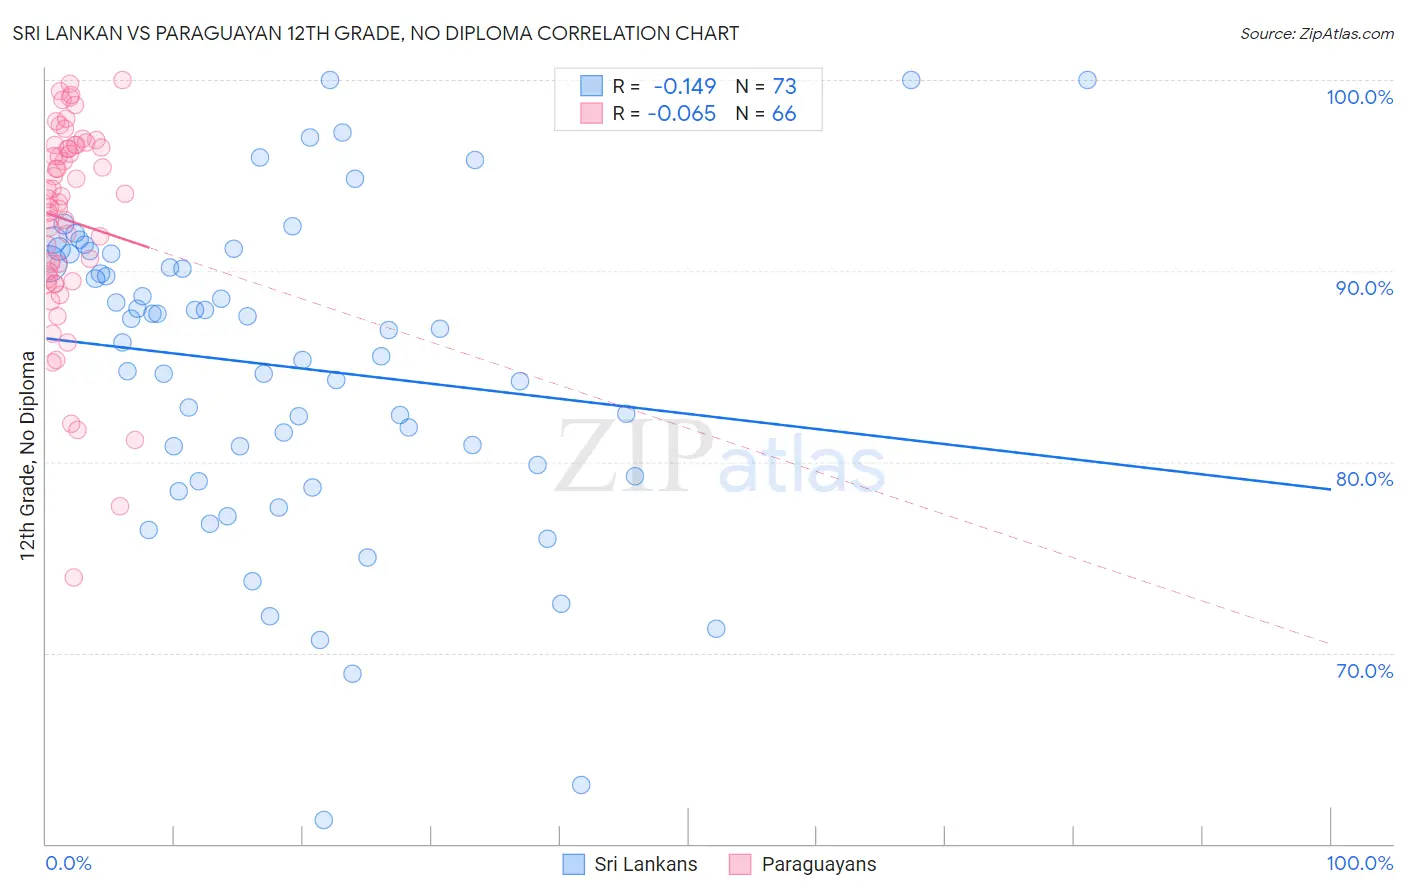
Sri Lankan vs Paraguayan 12th Grade, No Diploma Correlation Chart
The statistical analysis conducted on geographies consisting of 440,593,537 people shows a poor negative correlation between the proportion of Sri Lankans and percentage of population with at least 12th grade (no diploma) education in the United States with a correlation coefficient (R) of -0.149 and weighted average of 89.4%. Similarly, the statistical analysis conducted on geographies consisting of 95,114,201 people shows a slight negative correlation between the proportion of Paraguayans and percentage of population with at least 12th grade (no diploma) education in the United States with a correlation coefficient (R) of -0.065 and weighted average of 91.5%, a difference of 2.4%.
12th Grade, No Diploma Correlation Summary
| Measurement | Sri Lankan | Paraguayan |
| Minimum | 61.2% | 73.9% |
| Maximum | 100.0% | 100.0% |
| Range | 38.8% | 26.1% |
| Mean | 85.0% | 92.7% |
| Median | 86.9% | 93.8% |
| Interquartile 25% (IQ1) | 79.6% | 89.7% |
| Interquartile 75% (IQ3) | 90.9% | 96.6% |
| Interquartile Range (IQR) | 11.3% | 6.9% |
| Standard Deviation (Sample) | 8.2% | 5.4% |
| Standard Deviation (Population) | 8.2% | 5.4% |
Similar Demographics by 12th Grade, No Diploma
Demographics Similar to Sri Lankans by 12th Grade, No Diploma
In terms of 12th grade, no diploma, the demographic groups most similar to Sri Lankans are Trinidadian and Tobagonian (89.4%, a difference of 0.010%), Immigrants from Jamaica (89.5%, a difference of 0.040%), Seminole (89.4%, a difference of 0.090%), West Indian (89.3%, a difference of 0.090%), and Immigrants from Trinidad and Tobago (89.3%, a difference of 0.11%).
| Demographics | Rating | Rank | 12th Grade, No Diploma |
| Jamaicans | 0.5 /100 | #257 | Tragic 89.7% |
| Africans | 0.4 /100 | #258 | Tragic 89.6% |
| Immigrants | Western Africa | 0.4 /100 | #259 | Tragic 89.6% |
| Immigrants | South Eastern Asia | 0.4 /100 | #260 | Tragic 89.6% |
| Cheyenne | 0.4 /100 | #261 | Tragic 89.6% |
| Sioux | 0.4 /100 | #262 | Tragic 89.6% |
| Immigrants | Jamaica | 0.2 /100 | #263 | Tragic 89.5% |
| Sri Lankans | 0.2 /100 | #264 | Tragic 89.4% |
| Trinidadians and Tobagonians | 0.2 /100 | #265 | Tragic 89.4% |
| Seminole | 0.2 /100 | #266 | Tragic 89.4% |
| West Indians | 0.2 /100 | #267 | Tragic 89.3% |
| Immigrants | Trinidad and Tobago | 0.1 /100 | #268 | Tragic 89.3% |
| U.S. Virgin Islanders | 0.1 /100 | #269 | Tragic 89.3% |
| Bangladeshis | 0.1 /100 | #270 | Tragic 89.3% |
| Blacks/African Americans | 0.1 /100 | #271 | Tragic 89.3% |
Demographics Similar to Paraguayans by 12th Grade, No Diploma
In terms of 12th grade, no diploma, the demographic groups most similar to Paraguayans are Ugandan (91.5%, a difference of 0.0%), Chippewa (91.5%, a difference of 0.0%), Pakistani (91.5%, a difference of 0.010%), Indian (Asian) (91.5%, a difference of 0.010%), and Immigrants from Spain (91.6%, a difference of 0.020%).
| Demographics | Rating | Rank | 12th Grade, No Diploma |
| Immigrants | Argentina | 80.7 /100 | #143 | Excellent 91.6% |
| Immigrants | Spain | 80.1 /100 | #144 | Excellent 91.6% |
| Immigrants | Lebanon | 80.0 /100 | #145 | Excellent 91.6% |
| Immigrants | Brazil | 79.8 /100 | #146 | Good 91.5% |
| Pakistanis | 79.6 /100 | #147 | Good 91.5% |
| Indians (Asian) | 79.4 /100 | #148 | Good 91.5% |
| Ugandans | 79.0 /100 | #149 | Good 91.5% |
| Paraguayans | 78.9 /100 | #150 | Good 91.5% |
| Chippewa | 78.8 /100 | #151 | Good 91.5% |
| Kenyans | 77.4 /100 | #152 | Good 91.5% |
| Iraqis | 75.3 /100 | #153 | Good 91.5% |
| Immigrants | Kenya | 73.9 /100 | #154 | Good 91.5% |
| Immigrants | Iraq | 73.0 /100 | #155 | Good 91.4% |
| Asians | 71.9 /100 | #156 | Good 91.4% |
| Immigrants | Pakistan | 70.7 /100 | #157 | Good 91.4% |