French vs Immigrants from the Azores 12th Grade, No Diploma
COMPARE
French
Immigrants from the Azores
12th Grade, No Diploma
12th Grade, No Diploma Comparison
French
Immigrants from the Azores
92.6%
12TH GRADE, NO DIPLOMA
99.4/ 100
METRIC RATING
76th/ 347
METRIC RANK
85.3%
12TH GRADE, NO DIPLOMA
0.0/ 100
METRIC RATING
330th/ 347
METRIC RANK
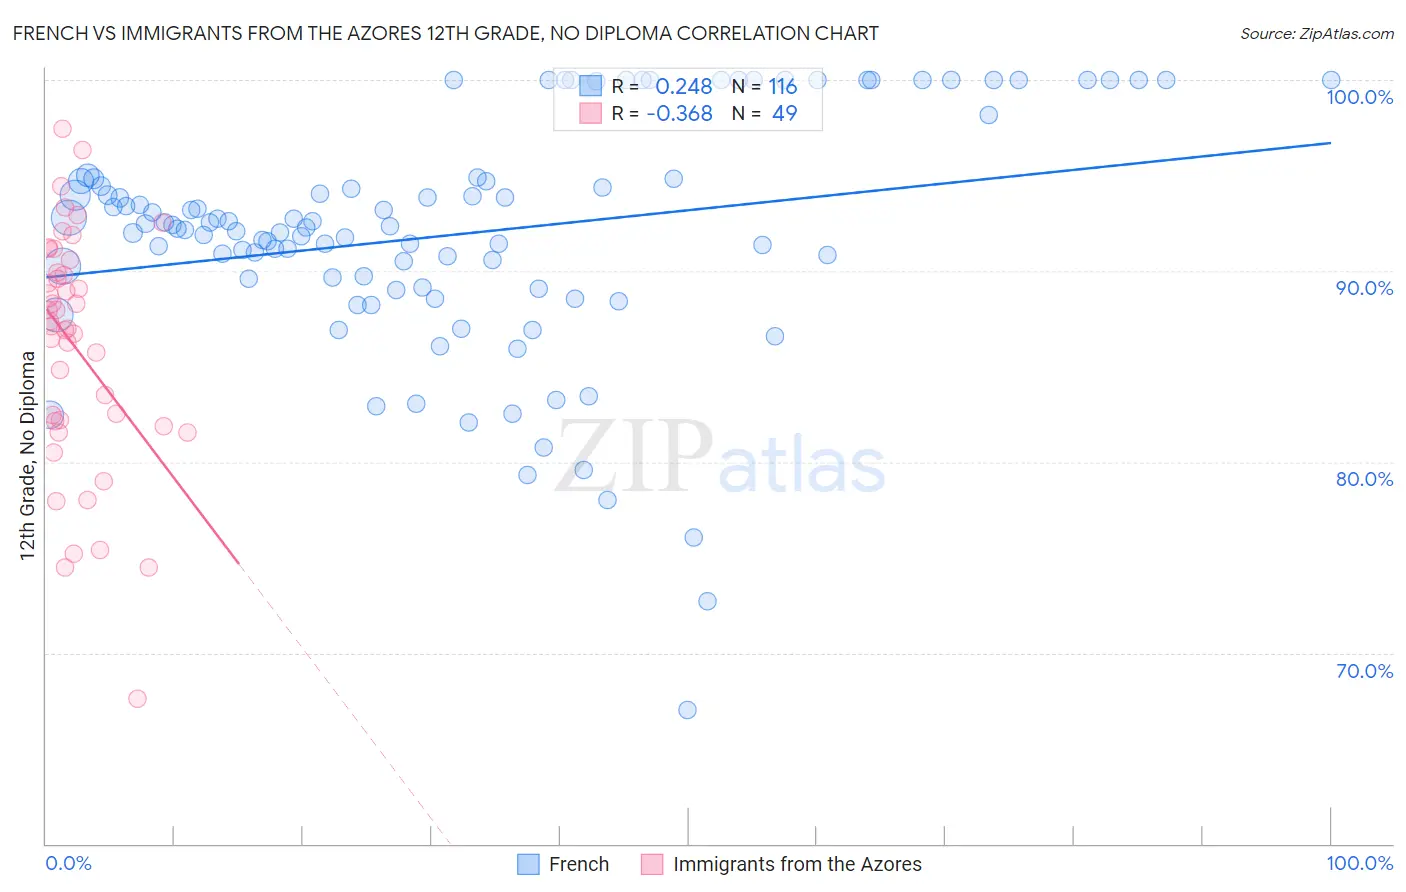
French vs Immigrants from the Azores 12th Grade, No Diploma Correlation Chart
The statistical analysis conducted on geographies consisting of 572,427,471 people shows a weak positive correlation between the proportion of French and percentage of population with at least 12th grade (no diploma) education in the United States with a correlation coefficient (R) of 0.248 and weighted average of 92.6%. Similarly, the statistical analysis conducted on geographies consisting of 46,257,310 people shows a mild negative correlation between the proportion of Immigrants from the Azores and percentage of population with at least 12th grade (no diploma) education in the United States with a correlation coefficient (R) of -0.368 and weighted average of 85.3%, a difference of 8.5%.
12th Grade, No Diploma Correlation Summary
| Measurement | French | Immigrants from the Azores |
| Minimum | 67.0% | 67.6% |
| Maximum | 100.0% | 97.5% |
| Range | 33.0% | 29.9% |
| Mean | 91.9% | 85.9% |
| Median | 92.3% | 87.1% |
| Interquartile 25% (IQ1) | 89.4% | 82.0% |
| Interquartile 75% (IQ3) | 94.8% | 90.2% |
| Interquartile Range (IQR) | 5.4% | 8.2% |
| Standard Deviation (Sample) | 6.2% | 6.3% |
| Standard Deviation (Population) | 6.2% | 6.2% |
Similar Demographics by 12th Grade, No Diploma
Demographics Similar to French by 12th Grade, No Diploma
In terms of 12th grade, no diploma, the demographic groups most similar to French are Immigrants from Moldova (92.6%, a difference of 0.0%), Native Hawaiian (92.6%, a difference of 0.0%), Burmese (92.6%, a difference of 0.010%), Immigrants from South Central Asia (92.6%, a difference of 0.020%), and Immigrants from England (92.6%, a difference of 0.020%).
| Demographics | Rating | Rank | 12th Grade, No Diploma |
| Immigrants | Iran | 99.5 /100 | #69 | Exceptional 92.7% |
| Czechoslovakians | 99.5 /100 | #70 | Exceptional 92.6% |
| Immigrants | Latvia | 99.5 /100 | #71 | Exceptional 92.6% |
| Immigrants | South Central Asia | 99.5 /100 | #72 | Exceptional 92.6% |
| Burmese | 99.4 /100 | #73 | Exceptional 92.6% |
| Immigrants | Moldova | 99.4 /100 | #74 | Exceptional 92.6% |
| Native Hawaiians | 99.4 /100 | #75 | Exceptional 92.6% |
| French | 99.4 /100 | #76 | Exceptional 92.6% |
| Immigrants | England | 99.4 /100 | #77 | Exceptional 92.6% |
| Cambodians | 99.3 /100 | #78 | Exceptional 92.6% |
| Romanians | 99.3 /100 | #79 | Exceptional 92.6% |
| French Canadians | 99.3 /100 | #80 | Exceptional 92.6% |
| Immigrants | Denmark | 99.2 /100 | #81 | Exceptional 92.5% |
| Immigrants | Switzerland | 99.2 /100 | #82 | Exceptional 92.5% |
| Immigrants | Israel | 99.2 /100 | #83 | Exceptional 92.5% |
Demographics Similar to Immigrants from the Azores by 12th Grade, No Diploma
In terms of 12th grade, no diploma, the demographic groups most similar to Immigrants from the Azores are Hispanic or Latino (85.4%, a difference of 0.14%), Central American (85.2%, a difference of 0.14%), Honduran (85.5%, a difference of 0.23%), Immigrants from Honduras (85.0%, a difference of 0.35%), and Lumbee (85.7%, a difference of 0.42%).
| Demographics | Rating | Rank | 12th Grade, No Diploma |
| Yuman | 0.0 /100 | #323 | Tragic 86.5% |
| Immigrants | Cabo Verde | 0.0 /100 | #324 | Tragic 85.8% |
| Mexican American Indians | 0.0 /100 | #325 | Tragic 85.7% |
| Dominicans | 0.0 /100 | #326 | Tragic 85.7% |
| Lumbee | 0.0 /100 | #327 | Tragic 85.7% |
| Hondurans | 0.0 /100 | #328 | Tragic 85.5% |
| Hispanics or Latinos | 0.0 /100 | #329 | Tragic 85.4% |
| Immigrants | Azores | 0.0 /100 | #330 | Tragic 85.3% |
| Central Americans | 0.0 /100 | #331 | Tragic 85.2% |
| Immigrants | Honduras | 0.0 /100 | #332 | Tragic 85.0% |
| Immigrants | Latin America | 0.0 /100 | #333 | Tragic 85.0% |
| Immigrants | Dominican Republic | 0.0 /100 | #334 | Tragic 84.9% |
| Immigrants | Yemen | 0.0 /100 | #335 | Tragic 84.8% |
| Tohono O'odham | 0.0 /100 | #336 | Tragic 84.7% |
| Pima | 0.0 /100 | #337 | Tragic 84.6% |