Immigrants from Thailand vs Romanian Doctorate Degree
COMPARE
Immigrants from Thailand
Romanian
Doctorate Degree
Doctorate Degree Comparison
Immigrants from Thailand
Romanians
1.8%
DOCTORATE DEGREE
49.4/ 100
METRIC RATING
175th/ 347
METRIC RANK
2.1%
DOCTORATE DEGREE
98.1/ 100
METRIC RATING
103rd/ 347
METRIC RANK
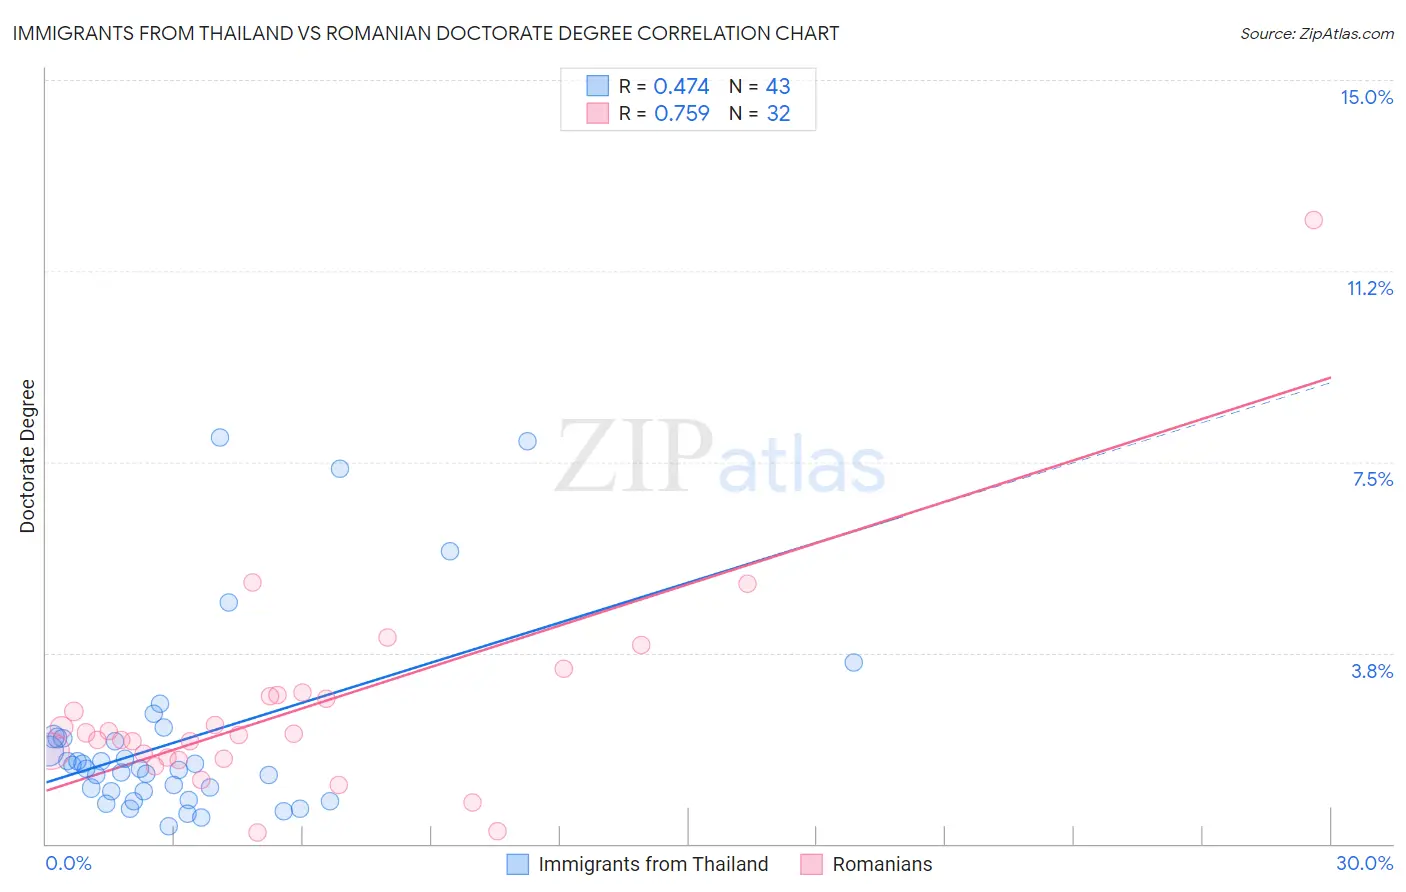
Immigrants from Thailand vs Romanian Doctorate Degree Correlation Chart
The statistical analysis conducted on geographies consisting of 315,045,663 people shows a moderate positive correlation between the proportion of Immigrants from Thailand and percentage of population with at least doctorate degree education in the United States with a correlation coefficient (R) of 0.474 and weighted average of 1.8%. Similarly, the statistical analysis conducted on geographies consisting of 374,979,448 people shows a strong positive correlation between the proportion of Romanians and percentage of population with at least doctorate degree education in the United States with a correlation coefficient (R) of 0.759 and weighted average of 2.1%, a difference of 14.5%.
Doctorate Degree Correlation Summary
| Measurement | Immigrants from Thailand | Romanian |
| Minimum | 0.35% | 0.21% |
| Maximum | 8.0% | 12.2% |
| Range | 7.6% | 12.0% |
| Mean | 2.1% | 2.6% |
| Median | 1.5% | 2.1% |
| Interquartile 25% (IQ1) | 1.0% | 1.7% |
| Interquartile 75% (IQ3) | 2.1% | 2.9% |
| Interquartile Range (IQR) | 1.1% | 1.2% |
| Standard Deviation (Sample) | 1.9% | 2.1% |
| Standard Deviation (Population) | 1.9% | 2.1% |
Similar Demographics by Doctorate Degree
Demographics Similar to Immigrants from Thailand by Doctorate Degree
In terms of doctorate degree, the demographic groups most similar to Immigrants from Thailand are Spanish (1.8%, a difference of 0.020%), Iraqi (1.8%, a difference of 0.030%), Immigrants from Bangladesh (1.8%, a difference of 0.080%), Norwegian (1.8%, a difference of 0.090%), and French (1.8%, a difference of 0.090%).
| Demographics | Rating | Rank | Doctorate Degree |
| Sri Lankans | 60.3 /100 | #168 | Good 1.9% |
| Vietnamese | 54.8 /100 | #169 | Average 1.9% |
| Costa Ricans | 53.3 /100 | #170 | Average 1.8% |
| Bermudans | 52.1 /100 | #171 | Average 1.8% |
| Belgians | 50.3 /100 | #172 | Average 1.8% |
| Norwegians | 50.0 /100 | #173 | Average 1.8% |
| Immigrants | Bangladesh | 50.0 /100 | #174 | Average 1.8% |
| Immigrants | Thailand | 49.4 /100 | #175 | Average 1.8% |
| Spanish | 49.3 /100 | #176 | Average 1.8% |
| Iraqis | 49.2 /100 | #177 | Average 1.8% |
| French | 48.8 /100 | #178 | Average 1.8% |
| Ghanaians | 48.3 /100 | #179 | Average 1.8% |
| Scandinavians | 48.0 /100 | #180 | Average 1.8% |
| Immigrants | Immigrants | 46.2 /100 | #181 | Average 1.8% |
| Immigrants | Afghanistan | 44.3 /100 | #182 | Average 1.8% |
Demographics Similar to Romanians by Doctorate Degree
In terms of doctorate degree, the demographic groups most similar to Romanians are Immigrants from Chile (2.1%, a difference of 0.010%), Austrian (2.1%, a difference of 0.12%), Immigrants from Eastern Africa (2.1%, a difference of 0.23%), Immigrants from Eastern Europe (2.1%, a difference of 0.26%), and Immigrants from Egypt (2.1%, a difference of 0.27%).
| Demographics | Rating | Rank | Doctorate Degree |
| Immigrants | Northern Africa | 98.4 /100 | #96 | Exceptional 2.1% |
| Immigrants | Eritrea | 98.4 /100 | #97 | Exceptional 2.1% |
| Armenians | 98.3 /100 | #98 | Exceptional 2.1% |
| Immigrants | Egypt | 98.2 /100 | #99 | Exceptional 2.1% |
| Immigrants | Eastern Europe | 98.2 /100 | #100 | Exceptional 2.1% |
| Immigrants | Eastern Africa | 98.2 /100 | #101 | Exceptional 2.1% |
| Immigrants | Chile | 98.1 /100 | #102 | Exceptional 2.1% |
| Romanians | 98.1 /100 | #103 | Exceptional 2.1% |
| Austrians | 98.0 /100 | #104 | Exceptional 2.1% |
| Arabs | 97.8 /100 | #105 | Exceptional 2.1% |
| Sudanese | 97.7 /100 | #106 | Exceptional 2.1% |
| Europeans | 97.5 /100 | #107 | Exceptional 2.1% |
| Immigrants | Germany | 97.3 /100 | #108 | Exceptional 2.1% |
| Ukrainians | 97.2 /100 | #109 | Exceptional 2.1% |
| Brazilians | 97.2 /100 | #110 | Exceptional 2.1% |