Immigrants from South Central Asia vs Immigrants from Spain 1st Grade
COMPARE
Immigrants from South Central Asia
Immigrants from Spain
1st Grade
1st Grade Comparison
Immigrants from South Central Asia
Immigrants from Spain
98.0%
1ST GRADE
66.2/ 100
METRIC RATING
156th/ 347
METRIC RANK
97.9%
1ST GRADE
54.9/ 100
METRIC RATING
170th/ 347
METRIC RANK
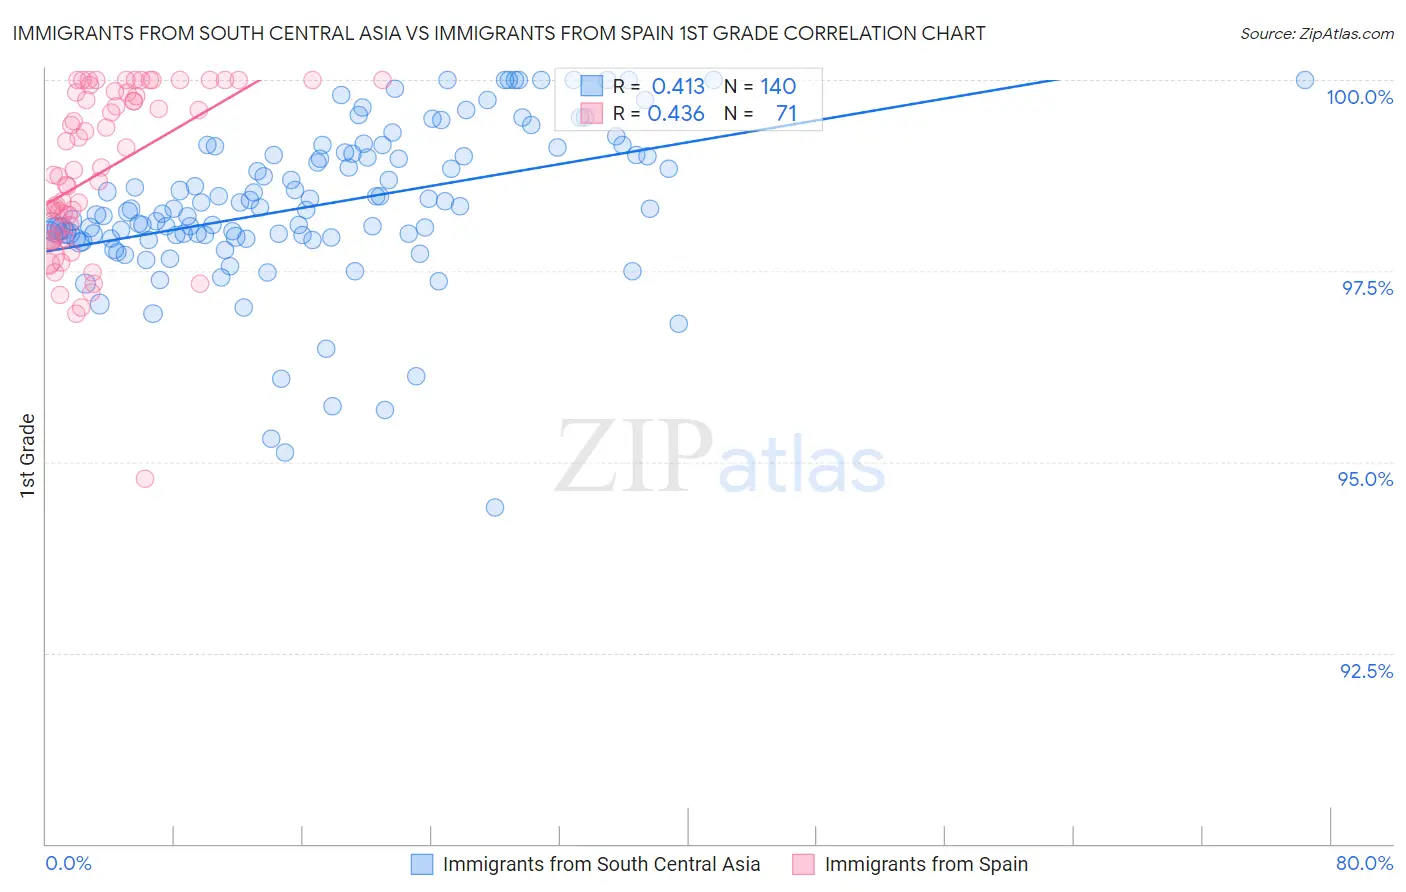
Immigrants from South Central Asia vs Immigrants from Spain 1st Grade Correlation Chart
The statistical analysis conducted on geographies consisting of 473,113,181 people shows a moderate positive correlation between the proportion of Immigrants from South Central Asia and percentage of population with at least 1st grade education in the United States with a correlation coefficient (R) of 0.413 and weighted average of 98.0%. Similarly, the statistical analysis conducted on geographies consisting of 239,682,160 people shows a moderate positive correlation between the proportion of Immigrants from Spain and percentage of population with at least 1st grade education in the United States with a correlation coefficient (R) of 0.436 and weighted average of 97.9%, a difference of 0.040%.
1st Grade Correlation Summary
| Measurement | Immigrants from South Central Asia | Immigrants from Spain |
| Minimum | 94.4% | 94.8% |
| Maximum | 100.0% | 100.0% |
| Range | 5.6% | 5.2% |
| Mean | 98.4% | 98.8% |
| Median | 98.3% | 98.8% |
| Interquartile 25% (IQ1) | 97.9% | 98.0% |
| Interquartile 75% (IQ3) | 99.0% | 99.8% |
| Interquartile Range (IQR) | 1.1% | 1.9% |
| Standard Deviation (Sample) | 1.0% | 1.1% |
| Standard Deviation (Population) | 1.0% | 1.1% |
Demographics Similar to Immigrants from South Central Asia and Immigrants from Spain by 1st Grade
In terms of 1st grade, the demographic groups most similar to Immigrants from South Central Asia are Immigrants from Iran (98.0%, a difference of 0.0%), Comanche (98.0%, a difference of 0.0%), Immigrants from North Macedonia (98.0%, a difference of 0.0%), Soviet Union (98.0%, a difference of 0.010%), and Venezuelan (98.0%, a difference of 0.010%). Similarly, the demographic groups most similar to Immigrants from Spain are Bermudan (97.9%, a difference of 0.0%), Chilean (97.9%, a difference of 0.0%), Immigrants from Micronesia (97.9%, a difference of 0.0%), Immigrants from Jordan (97.9%, a difference of 0.0%), and Immigrants from Russia (97.9%, a difference of 0.010%).
| Demographics | Rating | Rank | 1st Grade |
| Soviet Union | 68.9 /100 | #153 | Good 98.0% |
| Immigrants | Iran | 66.9 /100 | #154 | Good 98.0% |
| Comanche | 66.9 /100 | #155 | Good 98.0% |
| Immigrants | South Central Asia | 66.2 /100 | #156 | Good 98.0% |
| Immigrants | North Macedonia | 65.3 /100 | #157 | Good 98.0% |
| Venezuelans | 64.7 /100 | #158 | Good 98.0% |
| French American Indians | 63.7 /100 | #159 | Good 98.0% |
| Immigrants | Russia | 59.2 /100 | #160 | Average 97.9% |
| Immigrants | Italy | 59.1 /100 | #161 | Average 97.9% |
| Immigrants | Eastern Europe | 58.9 /100 | #162 | Average 97.9% |
| Spanish Americans | 57.7 /100 | #163 | Average 97.9% |
| Brazilians | 57.6 /100 | #164 | Average 97.9% |
| Ugandans | 56.9 /100 | #165 | Average 97.9% |
| Navajo | 56.6 /100 | #166 | Average 97.9% |
| Bermudans | 56.3 /100 | #167 | Average 97.9% |
| Chileans | 55.6 /100 | #168 | Average 97.9% |
| Immigrants | Micronesia | 55.3 /100 | #169 | Average 97.9% |
| Immigrants | Spain | 54.9 /100 | #170 | Average 97.9% |
| Immigrants | Jordan | 53.9 /100 | #171 | Average 97.9% |
| Immigrants | Korea | 53.0 /100 | #172 | Average 97.9% |
| Kenyans | 51.2 /100 | #173 | Average 97.9% |