Immigrants from Moldova vs Sierra Leonean Professional Degree
COMPARE
Immigrants from Moldova
Sierra Leonean
Professional Degree
Professional Degree Comparison
Immigrants from Moldova
Sierra Leoneans
4.9%
PROFESSIONAL DEGREE
94.8/ 100
METRIC RATING
121st/ 347
METRIC RANK
4.5%
PROFESSIONAL DEGREE
64.3/ 100
METRIC RATING
163rd/ 347
METRIC RANK
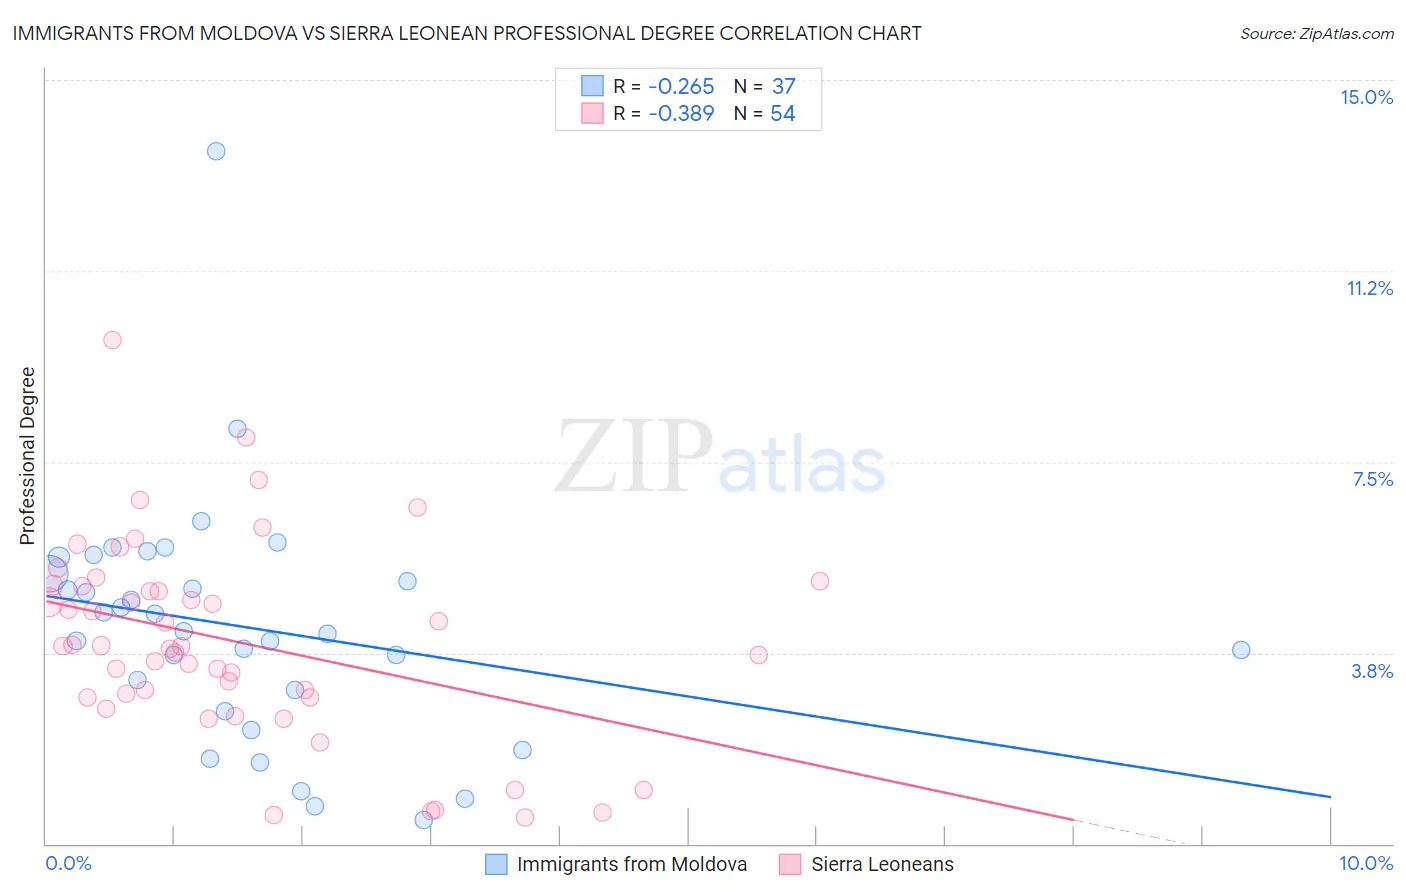
Immigrants from Moldova vs Sierra Leonean Professional Degree Correlation Chart
The statistical analysis conducted on geographies consisting of 124,337,930 people shows a weak negative correlation between the proportion of Immigrants from Moldova and percentage of population with at least professional degree education in the United States with a correlation coefficient (R) of -0.265 and weighted average of 4.9%. Similarly, the statistical analysis conducted on geographies consisting of 83,321,250 people shows a mild negative correlation between the proportion of Sierra Leoneans and percentage of population with at least professional degree education in the United States with a correlation coefficient (R) of -0.389 and weighted average of 4.5%, a difference of 8.3%.
Professional Degree Correlation Summary
| Measurement | Immigrants from Moldova | Sierra Leonean |
| Minimum | 0.45% | 0.52% |
| Maximum | 13.6% | 9.9% |
| Range | 13.1% | 9.4% |
| Mean | 4.2% | 4.0% |
| Median | 4.2% | 3.9% |
| Interquartile 25% (IQ1) | 2.8% | 2.9% |
| Interquartile 75% (IQ3) | 5.5% | 5.1% |
| Interquartile Range (IQR) | 2.7% | 2.2% |
| Standard Deviation (Sample) | 2.4% | 1.9% |
| Standard Deviation (Population) | 2.3% | 1.9% |
Similar Demographics by Professional Degree
Demographics Similar to Immigrants from Moldova by Professional Degree
In terms of professional degree, the demographic groups most similar to Immigrants from Moldova are Albanian (4.9%, a difference of 0.35%), Immigrants from Sudan (4.9%, a difference of 0.36%), Immigrants from Germany (4.9%, a difference of 0.46%), Immigrants from Venezuela (4.8%, a difference of 0.63%), and Immigrants from Eritrea (4.8%, a difference of 0.82%).
| Demographics | Rating | Rank | Professional Degree |
| Immigrants | Morocco | 96.8 /100 | #114 | Exceptional 5.0% |
| Moroccans | 96.8 /100 | #115 | Exceptional 5.0% |
| Venezuelans | 96.3 /100 | #116 | Exceptional 4.9% |
| Immigrants | Syria | 96.0 /100 | #117 | Exceptional 4.9% |
| Croatians | 96.0 /100 | #118 | Exceptional 4.9% |
| Immigrants | Sudan | 95.4 /100 | #119 | Exceptional 4.9% |
| Albanians | 95.3 /100 | #120 | Exceptional 4.9% |
| Immigrants | Moldova | 94.8 /100 | #121 | Exceptional 4.9% |
| Immigrants | Germany | 94.1 /100 | #122 | Exceptional 4.9% |
| Immigrants | Venezuela | 93.8 /100 | #123 | Exceptional 4.8% |
| Immigrants | Eritrea | 93.5 /100 | #124 | Exceptional 4.8% |
| Immigrants | Albania | 93.3 /100 | #125 | Exceptional 4.8% |
| Europeans | 93.2 /100 | #126 | Exceptional 4.8% |
| Serbians | 92.6 /100 | #127 | Exceptional 4.8% |
| Immigrants | Eastern Africa | 92.5 /100 | #128 | Exceptional 4.8% |
Demographics Similar to Sierra Leoneans by Professional Degree
In terms of professional degree, the demographic groups most similar to Sierra Leoneans are Peruvian (4.5%, a difference of 0.14%), Assyrian/Chaldean/Syriac (4.5%, a difference of 0.48%), Swiss (4.5%, a difference of 0.50%), Immigrants from Senegal (4.5%, a difference of 0.59%), and Vietnamese (4.5%, a difference of 0.64%).
| Demographics | Rating | Rank | Professional Degree |
| Swedes | 69.9 /100 | #156 | Good 4.5% |
| Iraqis | 69.8 /100 | #157 | Good 4.5% |
| Immigrants | Armenia | 68.8 /100 | #158 | Good 4.5% |
| Vietnamese | 68.4 /100 | #159 | Good 4.5% |
| Immigrants | Senegal | 68.0 /100 | #160 | Good 4.5% |
| Assyrians/Chaldeans/Syriacs | 67.4 /100 | #161 | Good 4.5% |
| Peruvians | 65.2 /100 | #162 | Good 4.5% |
| Sierra Leoneans | 64.3 /100 | #163 | Good 4.5% |
| Swiss | 61.0 /100 | #164 | Good 4.5% |
| Costa Ricans | 59.9 /100 | #165 | Average 4.5% |
| Immigrants | Colombia | 59.4 /100 | #166 | Average 4.5% |
| Immigrants | Afghanistan | 59.2 /100 | #167 | Average 4.5% |
| Immigrants | Sierra Leone | 58.7 /100 | #168 | Average 4.5% |
| Chinese | 58.6 /100 | #169 | Average 4.5% |
| Immigrants | Zaire | 57.4 /100 | #170 | Average 4.5% |