Carpatho Rusyn vs Sudanese 2nd Grade
COMPARE
Carpatho Rusyn
Sudanese
2nd Grade
2nd Grade Comparison
Carpatho Rusyns
Sudanese
98.6%
2ND GRADE
100.0/ 100
METRIC RATING
12th/ 347
METRIC RANK
97.7%
2ND GRADE
5.7/ 100
METRIC RATING
218th/ 347
METRIC RANK
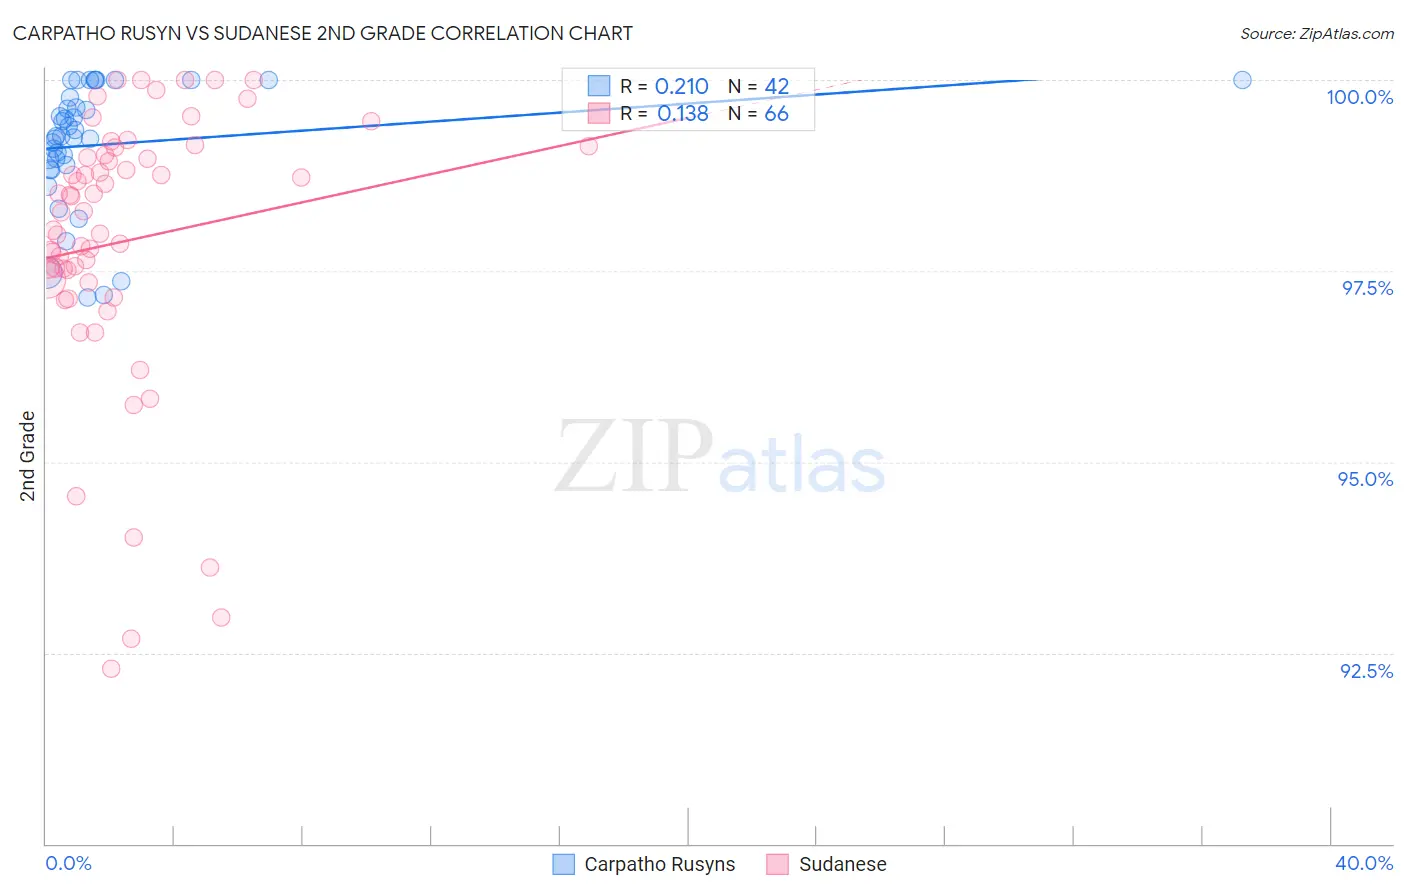
Carpatho Rusyn vs Sudanese 2nd Grade Correlation Chart
The statistical analysis conducted on geographies consisting of 58,871,690 people shows a weak positive correlation between the proportion of Carpatho Rusyns and percentage of population with at least 2nd grade education in the United States with a correlation coefficient (R) of 0.210 and weighted average of 98.6%. Similarly, the statistical analysis conducted on geographies consisting of 110,135,898 people shows a poor positive correlation between the proportion of Sudanese and percentage of population with at least 2nd grade education in the United States with a correlation coefficient (R) of 0.138 and weighted average of 97.7%, a difference of 0.99%.
2nd Grade Correlation Summary
| Measurement | Carpatho Rusyn | Sudanese |
| Minimum | 97.2% | 92.3% |
| Maximum | 100.0% | 100.0% |
| Range | 2.8% | 7.7% |
| Mean | 99.2% | 97.9% |
| Median | 99.3% | 98.3% |
| Interquartile 25% (IQ1) | 98.9% | 97.4% |
| Interquartile 75% (IQ3) | 99.8% | 99.0% |
| Interquartile Range (IQR) | 0.88% | 1.6% |
| Standard Deviation (Sample) | 0.81% | 1.8% |
| Standard Deviation (Population) | 0.80% | 1.8% |
Similar Demographics by 2nd Grade
Demographics Similar to Carpatho Rusyns by 2nd Grade
In terms of 2nd grade, the demographic groups most similar to Carpatho Rusyns are English (98.6%, a difference of 0.0%), Slovene (98.6%, a difference of 0.010%), Tlingit-Haida (98.6%, a difference of 0.010%), Swedish (98.6%, a difference of 0.020%), and Scottish (98.6%, a difference of 0.030%).
| Demographics | Rating | Rank | 2nd Grade |
| Alaskan Athabascans | 100.0 /100 | #5 | Exceptional 98.7% |
| Alaska Natives | 100.0 /100 | #6 | Exceptional 98.7% |
| Norwegians | 100.0 /100 | #7 | Exceptional 98.7% |
| Germans | 100.0 /100 | #8 | Exceptional 98.7% |
| Slovaks | 100.0 /100 | #9 | Exceptional 98.7% |
| Slovenes | 100.0 /100 | #10 | Exceptional 98.6% |
| Tlingit-Haida | 100.0 /100 | #11 | Exceptional 98.6% |
| Carpatho Rusyns | 100.0 /100 | #12 | Exceptional 98.6% |
| English | 100.0 /100 | #13 | Exceptional 98.6% |
| Swedes | 100.0 /100 | #14 | Exceptional 98.6% |
| Scottish | 100.0 /100 | #15 | Exceptional 98.6% |
| Dutch | 100.0 /100 | #16 | Exceptional 98.6% |
| Aleuts | 100.0 /100 | #17 | Exceptional 98.6% |
| Irish | 100.0 /100 | #18 | Exceptional 98.6% |
| Finns | 100.0 /100 | #19 | Exceptional 98.5% |
Demographics Similar to Sudanese by 2nd Grade
In terms of 2nd grade, the demographic groups most similar to Sudanese are South American Indian (97.7%, a difference of 0.010%), Uruguayan (97.7%, a difference of 0.010%), Immigrants from Panama (97.6%, a difference of 0.010%), Immigrants from Morocco (97.6%, a difference of 0.010%), and Samoan (97.7%, a difference of 0.020%).
| Demographics | Rating | Rank | 2nd Grade |
| Laotians | 9.9 /100 | #211 | Tragic 97.7% |
| Immigrants | Bahamas | 8.4 /100 | #212 | Tragic 97.7% |
| Moroccans | 8.2 /100 | #213 | Tragic 97.7% |
| Samoans | 7.1 /100 | #214 | Tragic 97.7% |
| Bahamians | 6.8 /100 | #215 | Tragic 97.7% |
| South American Indians | 6.7 /100 | #216 | Tragic 97.7% |
| Uruguayans | 6.2 /100 | #217 | Tragic 97.7% |
| Sudanese | 5.7 /100 | #218 | Tragic 97.7% |
| Immigrants | Panama | 5.1 /100 | #219 | Tragic 97.6% |
| Immigrants | Morocco | 5.0 /100 | #220 | Tragic 97.6% |
| Iraqis | 4.6 /100 | #221 | Tragic 97.6% |
| Immigrants | Sudan | 4.5 /100 | #222 | Tragic 97.6% |
| Sierra Leoneans | 4.3 /100 | #223 | Tragic 97.6% |
| Immigrants | Zaire | 4.3 /100 | #224 | Tragic 97.6% |
| Tongans | 4.3 /100 | #225 | Tragic 97.6% |